Spearman’s rank order correlation is a non-parametric test that we use to measure the strength and direction of the relationship between two variables measured on an ordinal, interval, or ratio scale. In this tutorial, we explain when you should use Spearman’s correlation; and how to calculate and interpret it in SPSS.
Quick Steps
- Click Analyze -> Correlate -> Bivariate
- Click Reset (recommended)
- Move the two variables of interest to the Variables box on the right
- Uncheck the Pearson box
- Place a check in the Spearman box
- Ensure that the Flag significant correlations box is checked
- Place a check in the Show only the lower triangle box (recommended if this option is available in your version of SPSS)
- Uncheck the Show diagonal box (recommended if this options is available in your version of SPSS)
- Click OK
When to Use Spearman’s Correlation
Spearman’s correlation assumes:
- That the variables of interest are measured at the ordinal, ratio, or interval level and
- That the relationship between these variables is monotonic. This means that the relationship between your variables is consistently in one direction such that:
-
- as the value of one variable increases, the value of the other variable also increases OR
- as the value of one variable increases, the value of the other variable decreases
We recommend that you visualize the relationship between your variables with a scatterplot before calculating Spearman’s correlation, to ensure that it is monotonic.
If the relationship between your variables is monotonic, Spearman’s correlation serves as an alternative to Pearson’s correlation coefficient in the following scenarios:
- When either or both of your variables are measured on an ordinal scale, for example, student academic performance evaluated with letter grades (A, B, C, etc.).
- When the relationship between your variables is non-linear. A linear relationship between two variables is represented by a straight line on a scatterplot. See our scatterplot tutorial for visualizations of different relationships between variables.
- When the variables aren’t normally distributed. See our tutorial on testing for normality in SPSS.
- When the variances of the dependent variable for your populations aren’t equal. You can compute Levene’s test for equality of variances in SPSS.
Example
Our fictitious example data set contains the letter grades received by 40 high school students for their French written exam as well those they received for their French oral exam. We want to find out whether there is an association between the grades that students receive on their written and oral exams. Since letter grades are ordinal data, we will calculate Spearman’s correlation to explore this question.
Setup in SPSS
We start from the assumption that you have already imported your data into SPSS and that you’re looking at something like the data set below:
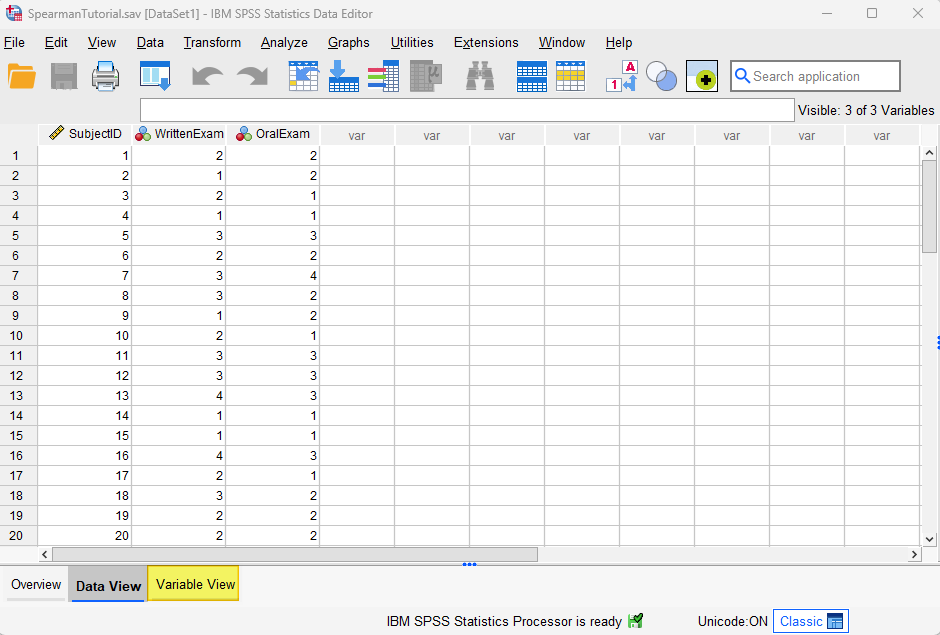
Note that we have recorded the letter grades that students received for their written and oral exams as numeric values. The values 1, 2, 3, 4, and 5 represent the letter grades A, B, C, D and E, respectively. We have coded these letter grades numerically because SPSS cannot calculate a Spearman’s correlation with string data.
Follow the steps below to ensure that your your variables are correctly defined in SPSS.
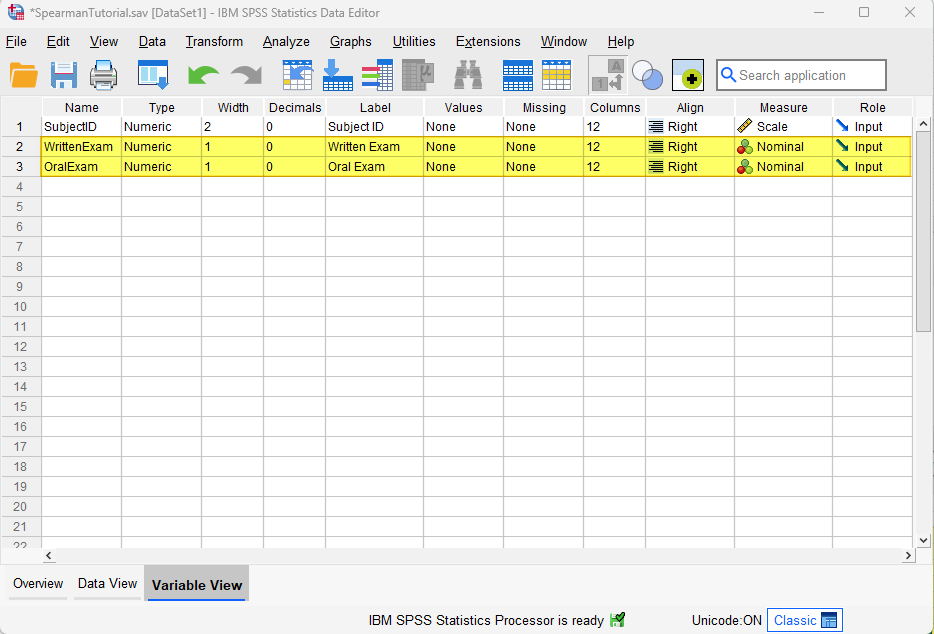
First, click the Variable View tab (highlighted in the screenshot above). The two variables for our Spearman’s correlation are highlighted below:
We have a tutorial that provides a general overview of defining variables in SPSS. Here, however, we will focus on specific considerations to keep in mind when defining variables for a Spearman’s correlation.
Type
Firstly, make sure that Type is set to Numeric for these variables. If it isn’t, place your cursor, on the Type cell for the variable, then select the three dots on the right of the cell as illustrated below.
![]()
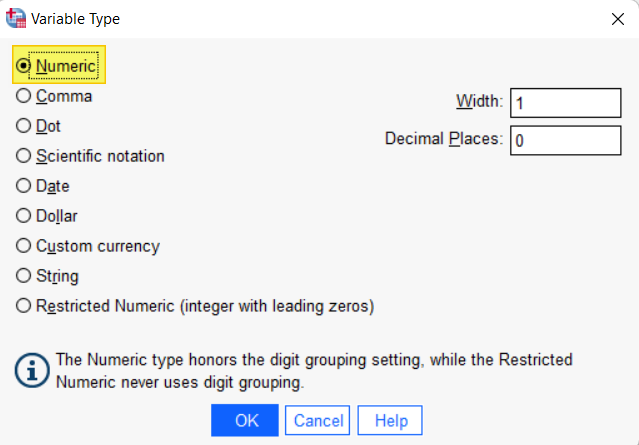
This brings up the Variable Type dialog box below. Select Numeric, then select OK.
Values
If the numeric values indicate a subject’s rank position for the variable (for example, 1 = ranked first in your data set, 2 = ranked second, etc.), then there are no actions for you here. Feel free to jump down to the Measure section below. If, however, the numeric values represent something else (e.g., letter grades), then we need to define this in the Values cell. To do this, start by clicking on the Values cell for each of these variables. Then select the three dots on the right of the cell as illustrated below.
![]()
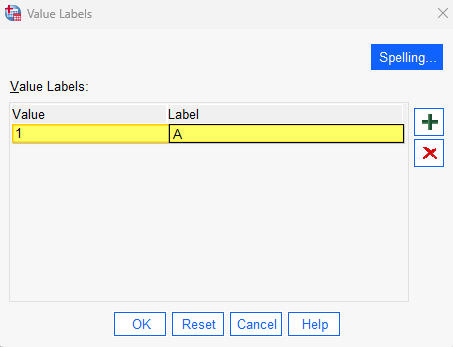
This brings up the Value Labels dialog box illustrated below:
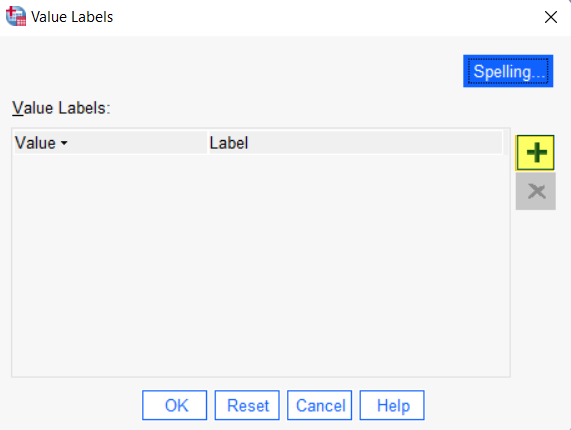
Click the [+] button highlighted above. SPSS will then add a cell under Value and a cell under Label. In the cell under Value type your first value (“1” in our example). In the cell under Label type the label for that value (“A” in our example):
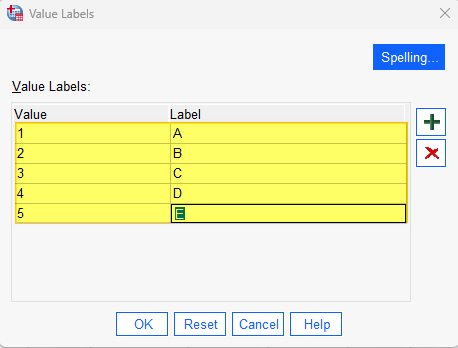
Click the [+] button again and add your next value and label as before. Repeat these steps until you have added all of the value labels for that Spearman’s variable as per our example below:
Select OK to save and close the Value Labels dialog box and return to the Variable View
Measure
The Measure for each of your Spearman’s variables should be set to one of the following:
- Ordinal: if your variable is measured on an ordinal scale (as is the case with our letter grades example).
- Scale: if your variable is measured on an interval or ratio scale, but you are calculating Spearman’s correlation as an alternative to Pearson’s correlation for one of the reasons outlined earlier. For example, if you had numeric scores for your students’ exams but the relationship between the scores for the written exam and those for the oral exam was non-linear, you could calculate Spearman’s correlation.
If the data for one or both of your Spearman’s variables has been imported into SPSS with the wrong level of measurement, place your cursor in the Measure field and select the correct level of measurement from the drop-down menu. In our example, we select Ordinal.
Spearman’s Correlation
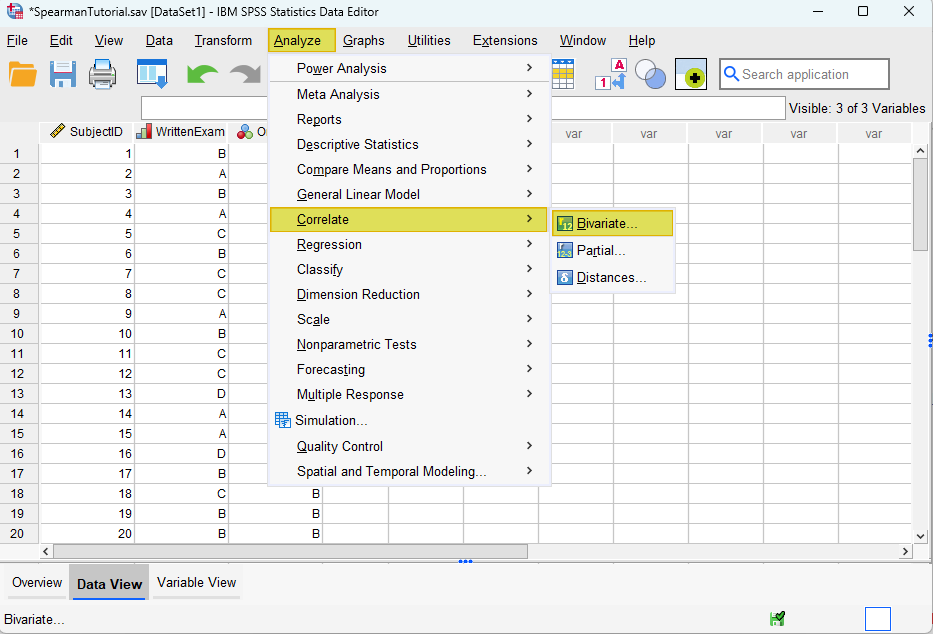
To start the Spearman’s correlation in SPSS, click Analyze -> Correlate -> Bivariate.
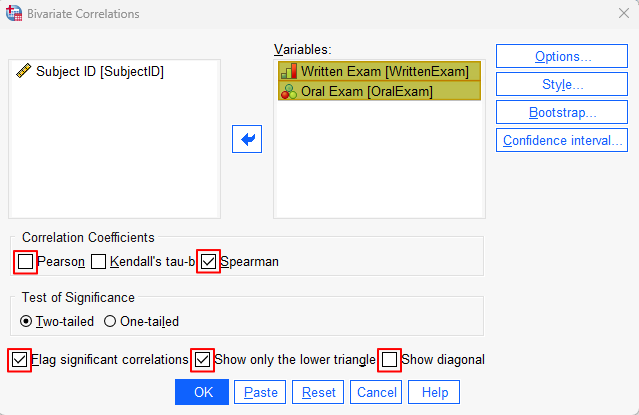
This brings up the Bivariate Correlations dialog box. We recommend that you click the Reset button to clear any previous settings.
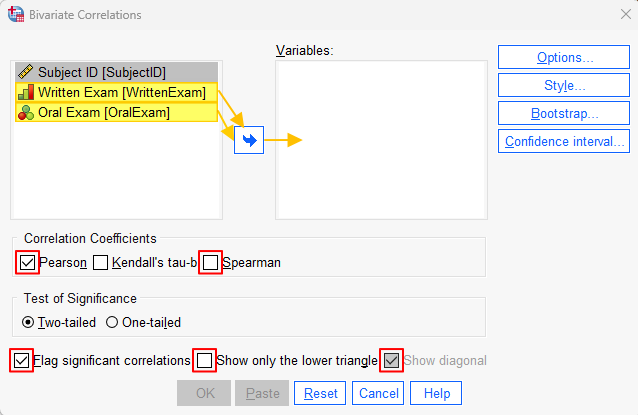
Then, holding down the CTRL key on your keyboard, select the two variables of interest (Written Exam Oral Exam in our example), and use the arrow key to move them to the Variables box on the right. Under “Correlation Coefficients” ensure that you uncheck the Pearson checkbox and place a check in the Spearman checkbox. Ensure that the Flag significant correlations box is checked.
If the following options are available in your version of SPSS, we recommended placing a check in the Show only the lower triangle box and unchecking the Show diagonal box. (Don’t worry if you don’t see these options – they are only available in the most recent versions of SPSS). Your dialog box should now look something like the screenshot below:
Click OK. The SPSS Output Viewer will pop up with the results of your Spearman’s correlation
Results and Interpretation
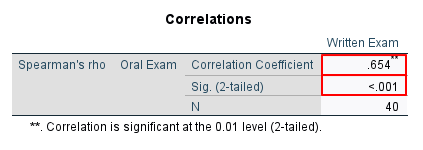
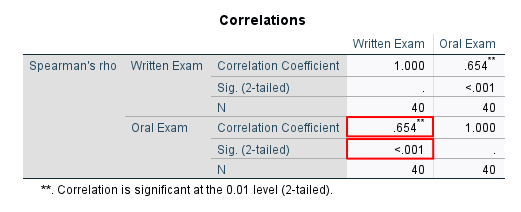
You will see a Correlations table. We are interested in two values in this table, namely the Correlation Coefficient for our two variables and the significance value (Sig. (2-tailed)) for that correlation. Both of these values are outlined in red in the two screenshots below.
The first screenshot is what you will see if you placed a check in the Show only the lower triangle box and unchecked the Show diagonal box in the Bivariate Correlations dialog box above. The second screenshot is what you will see if you did not place a check in the Show only the lower triangle box in this dialog box.
Correlation Coefficient
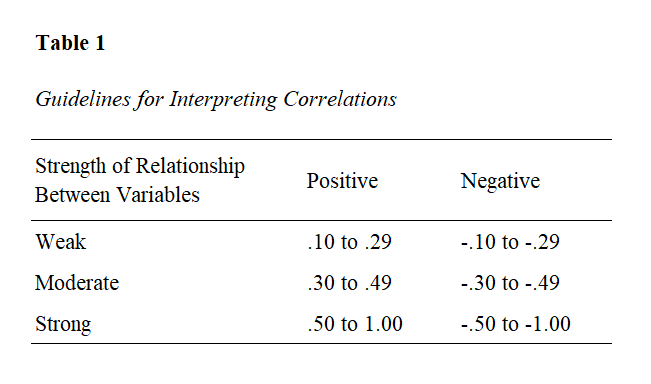
The range of possible values for the correlation coefficient is -1 to 1. -1 represents a perfect negative correlation between two variables, while 1 represents a perfect positive correlation between the two variables. A correlation coefficient of 0 indicates that there is no monotonic relationship between the variables. The Correlation Coefficient for our example is .654. As per the table below, this indicates a strong positive correlation.
Significance
The second value of interest is Sig. (2-tailed). The correlation between the two variables is significant if it is less than or equal to the alpha value that you have selected for your study. An alpha value of .05 is standard. Our significance value of < .001, therefore, is highly significant.
***************
That’s it for this tutorial. You should now be able to calculate and interpret Spearman’s correlation in SPSS. Check out our tutorial on reporting Spearman’s correlation from SPSS in APA style.
***************