This quick tutorial will explain how to test whether sample data is normally distributed in the SPSS statistics package.
It is a requirement of many parametric statistical tests – for example, the independent-samples t test – that data is normally distributed. There are a number of different ways to test this requirement. We’re going to focus on the Kolmogorov-Smirnov and Shapiro-Wilk tests.
Quick Steps
- Click Analyze -> Descriptive Statistics -> Explore…
- Move the variable of interest from the left box into the Dependent List box on the right.
- Click the Plots button, and tick the Normality plots with tests option.
- Click Continue, and then click OK.
- Your result will pop up – check out the Tests of Normality section.
The Data
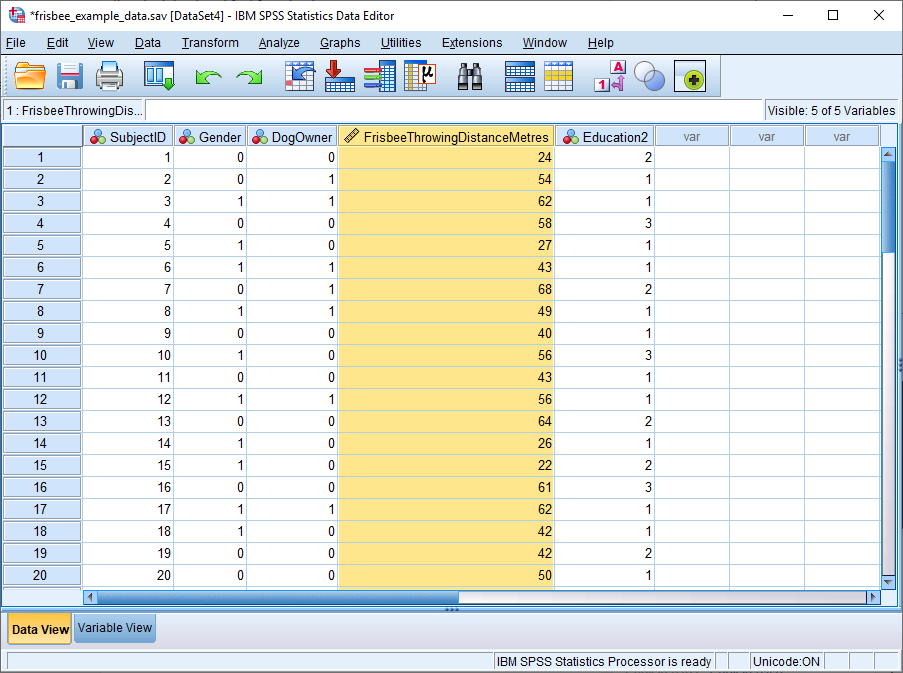
Our example data, displayed above in SPSS’s Data View, comes from a pretend study looking at the effect of dog ownership on the ability to throw a frisbee.
Frisbee Throwing Distance in Metres (highlighted) is the dependent variable, and we need to know whether it is normally distributed before deciding which statistical test to use to determine if dog ownership is related to the ability to throw a frisbee.
Test for Normality
To begin, click Analyze -> Descriptive Statistics -> Explore… This will bring up the Explore dialog box, as below.
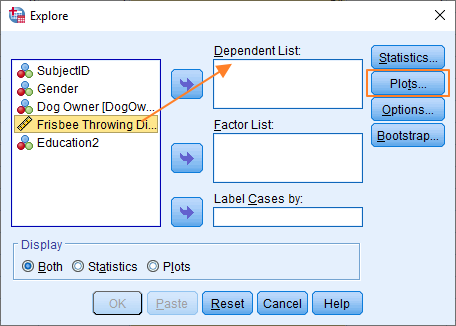
The set up here is quite easy.
First, you’ve got to get the Frisbee Throwing Distance variable over from the left box into the Dependent List box. You can either drag and drop, or use the blue arrow in the middle.
The Factor List box allows you to split your dependent variable on the basis of the different levels of your independent variable(s). In our example, Dog Owner, our independent variable, has two levels – owner and non-owner – so we could add Dog Owner to the Factor List box, and look at our dependent variable split on that basis. However, since we can perfectly well test for normality without adding in this extra complexity, we’ll just leave the box empty.
Once you’ve got the variable you want to test for normality into the Dependent List box, you should click the Plots button. The Plots dialog box will pop up.
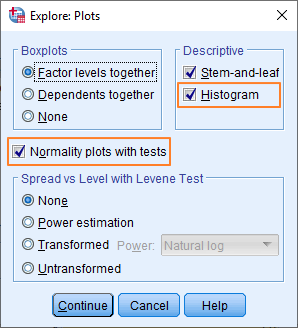
In this box, you want to make sure that the Normality plots with tests option is ticked, and it’s also sensible to select both descriptive statistics options (Stem-and-leaf and Histogram).
Now click Continue, which will take you back to the Explore dialog box. This should now look something like this.
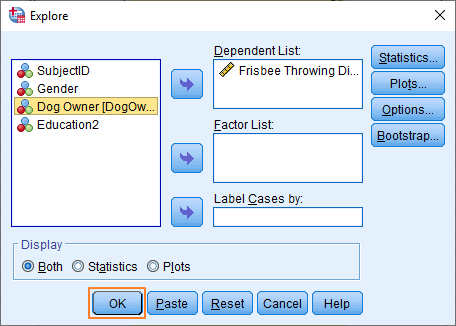
You’re now ready to test whether your data is normally distributed.
Press the OK button.
The Result
The Explore option in SPSS produces quite a lot of output. Here’s what you need to assess whether your data distribution is normal.
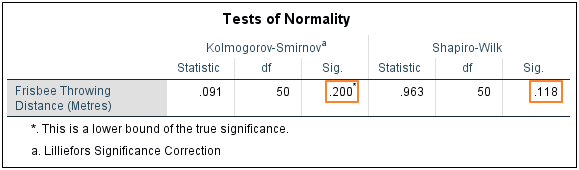
SPSS runs two statistical tests of normality – Kolmogorov-Smirnov and Shapiro-Wilk.
If the significance value is greater than the alpha value (we’ll use .05 as our alpha value), then there is no reason to think that our data differs significantly from a normal distribution – i.e., we can reject the null hypothesis that it is non-normal.
As you can see above, both tests give a significance value that’s greater than .05, therefore, we can be confident that our data is normally distributed.
A complication that can arise here occurs when the results of the two tests don’t agree – that is, when one test shows a significant result and the other doesn’t. In this situation, use the Shapiro-Wilk result – in most circumstances, it is more reliable.
Q-Q Plot
SPSS also provides a normal Q-Q Plot chart which provides a visual representation of the distribution of the data.
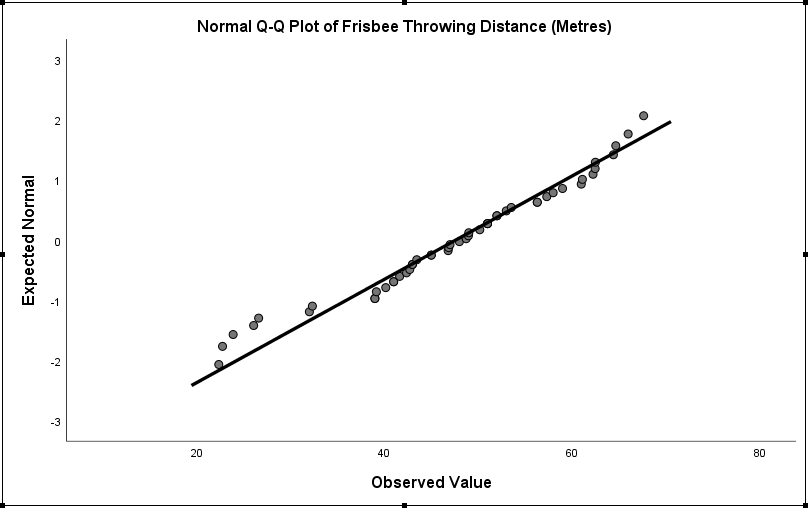
If a distribution is normal, then the dots will broadly follow the trend line.
As you can see above, our data does cluster around the trend line – which provides further evidence that our distribution is normal.
Put this Q-Q plot together with the results of the statistical tests, and we’re safe in assuming that our data is normally distributed. This means that at least one of the criteria for parametric statistical testing is satisfied.
If you wish to export the SPSS output for your test of normality to another application such as Word, Excel, or PDF, check out our tutorial.
***************
Okay, that’s this tutorial over and done with. You should now be able to interrogate your data in order to determine whether it is normally distributed.