In this tutorial we will show you how to report a Spearman’s rank order correlation from SPSS in APA style.
We have included two templates for reporting your Spearman’s correlation here. We will demonstrate how to populate these templates using the SPSS output from your own study. In addition, at the end of the tutorial, we present two examples of Spearman’s correlation reports, one written using each of our templates.
For more general information about formatting your reports in APA style, we suggest visiting the APA Style website.
Templates for Reporting a Spearman’s Correlations in APA Style
You will find our two templates for reporting your Spearman’s correlation below.
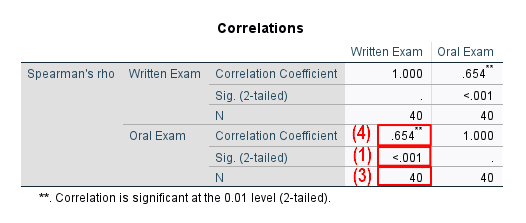
Use our first template if the relationship between your two variables is significant. The relationship is significant if the p value in the Sig. (2-tailed) row(s) of the Correlations table (see (1) in the screenshot below) is less than or equal to the alpha level you selected for your test. Selecting an alpha level of .05 is fairly typical.
Use our second template if the relationship between your two variables is not significant. The relationship isn’t significant if the p value in the Sig. (2-tailed) row(s) of the Correlations table is greater than the alpha level you selected for your test.
Replace the [blue text in square brackets] in the appropriate template with information from your own Spearman’s correlation. The (red numbers in parentheses) correspond to those on the screenshot of SPSS output below and/or to our notes and tips for writing your report (also below).
Spearman’s Correlation: Significant Relationship Between Variables
A Spearman’s correlation was conducted to evaluate the relationship between [variable 1] and [variable 2]. There was a significant [direction of relationship] (2) relationship between [variable 1] and [variable 2], rs([N(3)-2]) = [Spearman’s correlation] (4), p = [value of p] (1).
Spearman’s Correlation: No Significant Relationship Between Variables
A Spearman’s correlation was conducted to evaluate the relationship between [variable 1] and [variable 2]. The relationship between [variable 1] and [variable 2] was not significant, rs([N(3)-2]) = [Spearman’s correlation] (4), p = [value of p] (1).
Populating Our Spearman’s Correlation APA Templates from SPSS
The numbers on the screenshot of SPSS output correspond to those in the APA templates above. Use the values from your own SPSS output to populate the relevant template.
Our screenshot is from a Spearman’s correlation that we conducted to determine whether there was a relationship between the letter grades that a group of fictitious students received on their French written exam with those they received on their French oral exam.
As specified in the APA Style Guide:, you should: (a) indent the first line of each paragraph 0.5 inches from the left margin; and (b) double-space your text.
(1) Report the exact p value to two or three decimal places as presented in your SPSS output. However, if the p value is .000, report it as < .001. Do not add a leading zero to your p value.
(2) The relationship or correlation between your variables is positive if the value in (4) does not have a minus sign. A positive correlation means that, as the value of one variable increases, the value of the other variable increases too. So, in our example, students who received higher letter grades for their French written exam tended to also receive higher letter grades for their French oral exam.
A negative correlation means that, as the value of one variable increases, the value of the other variable tends to decrease.
(3) The value in the parentheses after rs is N-2, the degrees of freedom (df) for your Spearman’s correlation. You will find the value of N in the Correlations table. In our example N = 40 so the df is 38.
(4) Report the Spearman’s correlation (the value of rs) from the Correlation Coefficient row(s) of the Correlations table to two decimal places. Do not add a leading zero to this value.
Examples of Spearman’s Correlation Reports Written in APA Style
Spearman’s Correlation: Significant Relationship Between Variables
A Spearman’s correlation was conducted to evaluate the relationship between [the letter grades that students received for their French written exam] and [those they received for their French oral exam]. There was a significant [positive] relationship between [students’ French written exam grades] and [their French oral exam grades], rs([38]) = [.65], p = [< .001].
Spearman’s Correlation: No Significant Relationship Between Variables
A Spearman’s correlation was conducted to evaluate the relationship between [the letter grades that students received for their French written exam] and [those they received for their mid-term Art project]. The relationship between [students’ French written exam grades] and [their mid-term Art project grades] was not significant, rs([28]) = [.24], p = [.203].
***************
That’s it for this tutorial. You should now be able to report the results of your Spearman’s correlation from SPSS in APA style.
***************