In this tutorial, we will show you how to report the results of your simple linear regression analysis from SPSS in APA style.
First, we will provide a template that you can use to report your results. Next, we will show you how to populate this template using the SPSS output from your own analysis. Finally, we will provide an example of a simple linear regression report written using the template.
You can find more general information about formatting your reports in APA style by visiting the APA Style website.
Template for Reporting Simple Linear Regression in APA Style
A template for reporting simple linear regression is presented below. Replace the [blue text in square brackets] with information from your own simple linear regression analysis. The (red numbers in parentheses) correspond to the numbers on our screenshots of SPSS output and our notes for writing your report (see below for both).
APA Template Text
Simple linear regression analysis was conducted to evaluate the extent to which [independent/predictor variable] could predict [dependent/outcome/criterion variable].
A significant regression [was/was not] (1) found (F([df for regression] (2),[df for residual] (3)) = [F value] (4), p = [p value] (5)). The R2 was [R2 value] (6), indicating that [independent variable] explained approximately [R2 multiplied by 100]% (7) of the variance in [dependent variable]. The regression equation was:
[dependent variable] = [constant] (8) + [slope of the regression line](9)([independent variable]).
That is, for each one [independent variable unit of measurement] increase in [independent variable], the predicted [dependent variable] [increased/decreased] (10) by approximately [slope of regression line] (11) [dependent variable unit of measurement].
Confidence intervals indicated that we can be 95% certain that the slope to predict [dependent variable] from [independent variable] is between [lower bound of confidence interval for independent variable] (12) and [upper bound of confidence interval for independent variable] (13).
Populating the APA Template With Your SPSS Output
The screenshots of SPSS output below are from a simple linear regression analysis that we performed (on data from a fictitious study) to evaluate whether it was possible to use students’ SAT scores to predict their Psychology exam scores. The numbers on these screenshots reference numbers in our APA reporting template above. Use the corresponding values from your own SPSS output to populate the template.
The APA Style Guide states: (a) that the first line of each paragraph should be indented 0.5 inches from the left margin; and (b) that text should be double-spaced.
Please feel free to modify the wording of the template for your own report as needed, ensuring that you make it as easy as possible for the reader to understand your results.
Values from the ANOVA Table
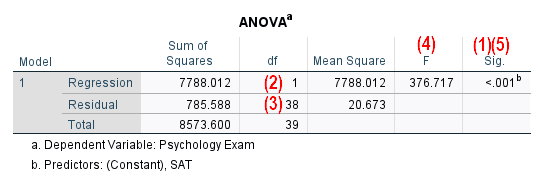
(1) Your simple linear regression is significant if the p value presented in the Sig. column of your ANOVA table is less than or equal to the alpha level you selected for your regression.
Select an alpha level before you conduct your regression analysis. An alpha level of .05 is typical.
Our p value of < .001 (reported in (5)) is less than our selected alpha level of .05, indicating that the regression model is significant.
If the p value for your simple linear regression is not significant, there is no need to include any of the information in the template after you report the p value in (5) below. It doesn’t make sense to interpret a non-significant regression.
(2) and (3) Report the degrees of freedom (df) from the Regression and Residual rows of the ANOVA table, respectively.
(4) Report the F value from the ANOVA table to two decimal places. Add a leading zero to your F value if it is less than 1.00 (for example an F value of .791 would be reported as 0.79).
(5) Report the exact p value as per the ANOVA table to two or three decimal places, and do not add a leading zero. However, if the p value is .000, report it as < .001.
Values from the Model Summary Table
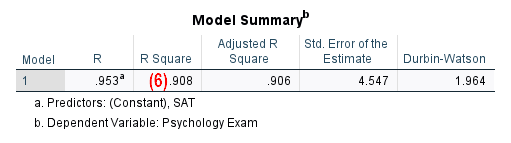
(6) You will find the value of R2 in the R Square column of the Model Summary table. We suggest reporting this value to two decimal places. If your sample size is small, consider reporting Adjusted R Square.
(7) To calculate the percentage of variance in the dependent variable (Psychology exam scores in our example) explained by the independent variable (SAT scores in our example), multiply R2 (in (6) above) by 100. In our example .91 x 100 = 91.
Values from the Coefficients Table
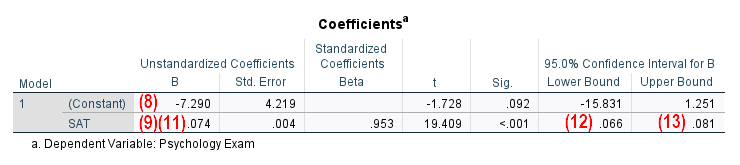
(8) We recommend reporting the Constant from the B column under Unstandardized Coefficients from the Coefficients table to two decimal places.
(9) You will find the slope of the regression line in column B under Unstandardized Coefficients in the row for your independent variable (SAT scores here) of the Coefficients table. As above, we recommend reporting this value to two decimal places.
(10) When the independent variable increases, the predicted value of the dependent value will:
- increase if the slope of the regression line (i.e., the value in (9)) is positive, or
- decrease if the slope of the regression line is negative.
(11) As per (9) above.
(12) and (13) Report the Lower and Upper Bounds presented in the row for the independent variable (SAT scores in our example) under 95.0% Confidence Interval for B in the Coefficients table. Report these values to two decimal places.
Example of a Simple Linear Regression Report in APA Style
Simple linear regression analysis was conducted to evaluate the extent to which [students’ SAT scores] could predict [their Psychology exam scores].
A significant regression [was] found (F([1],[38]) = [376.72], p = [< .001]). The R2 was [.91], indicating that [students’ SAT scores] explained approximately [91]% of the variance in [their Psychology exam scores]. The regression equation was:
[Psychology exam score] = [-7.29] + [.07]([SAT score]).
That is, for each one [point] increase in [a student’s SAT score], the predicted [Psychology exam score] [increased] by approximately [.07] [percentage points].
Confidence intervals indicated that we can be 95% certain that the slope to predict [students’ Psychology exam scores] from [SAT scores] is between [.07] and [.08].
***************
That’s it for this tutorial. You should now be able to report simple linear regression analysis from SPSS in APA style.
***************