This tutorial explains how to import data from Excel into the SPSS statistics package.
Preparing Excel
Open the Excel spreadsheet from which you wish to import data.
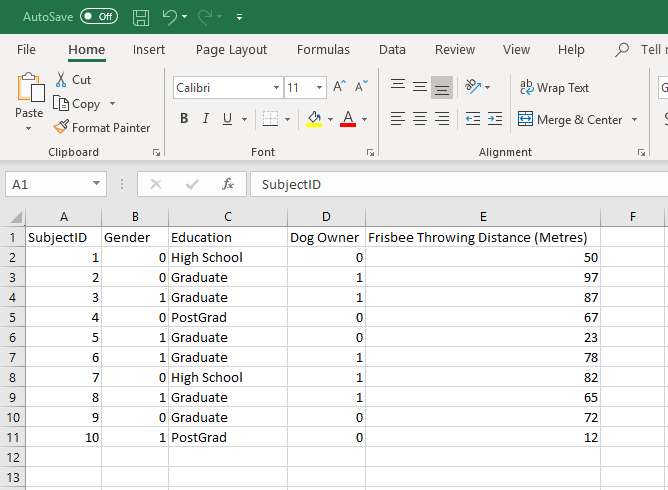
You can see in our example that we have 5 columns of data.
Before you begin the process of importing your data into SPSS, you need to ensure that your variable names are in the first row of the worksheet, and that there is no gap between the first and second rows. Our worksheet satisfies both these requirements.
It’s also wise to clean up your data. For example, if you had coded one of the Frisbee Throwing Distance items as “50m” rather than just “50”, this would be a good time to make a correction.
Once you have got your worksheet straight, you can open up SPSS.
Importing Data from Excel into SPSS
There are a number of different ways to import data into SPSS. We’re going to use a method that allows backward compatibility with older versions of SPSS.
To start, click File -> Open -> Data (as below).
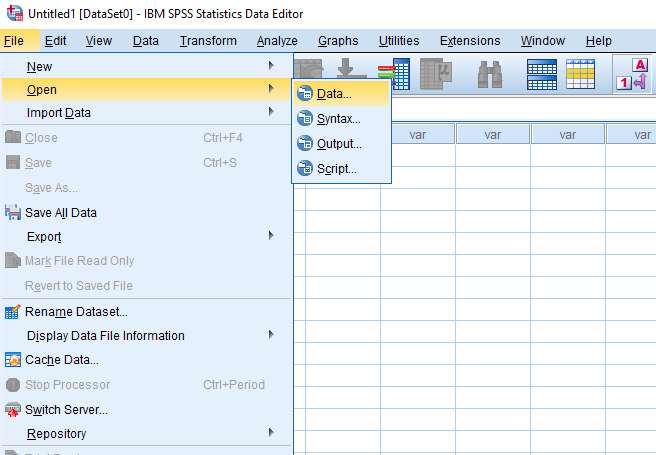
Once you click Data, the Open Data box will appear.
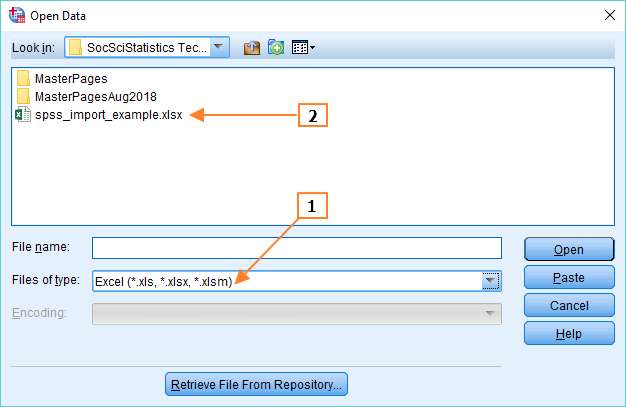
In the Files of type box, you need to select Excel (see 1 above, though obviously things will look slightly different if you’re using a Mac). Then navigate to the folder that contains your Excel file, and you’ll see your Excel file pop up (see 2 above). Open the file, and you’ll get the Read Excel File dialog box.
Read Excel File Dialog Box
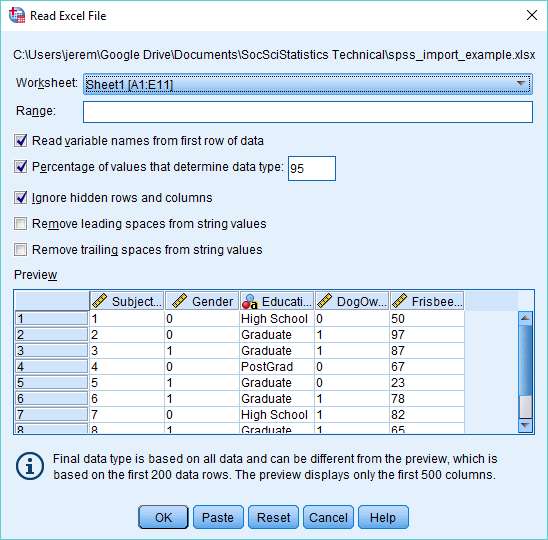
This dialog box offers a number of options. Mainly these are self-explanatory, but it is probably worth explaining the “Percentage of values that determine data type” option. This is how the latest version of SPSS assigns a data type to your variables. The percentage is the proportion of values in a particular column that must match a specific data type for SPSS to assign that data type to a variable. In our example, a variable will be assigned to a particular data type if 95% of values match that type (for example, if 95% of values are numeric in form). The value can be any number above 50. If SPSS is unable to determine a data type on this basis it will assign the variable to a string type.
Once you’ve selected the options you require, and checked your data looks okay in the preview window, press OK to begin the import.
Check Your Data Within SPSS
SPSS will import your data into a new Data View with variable names at the top.
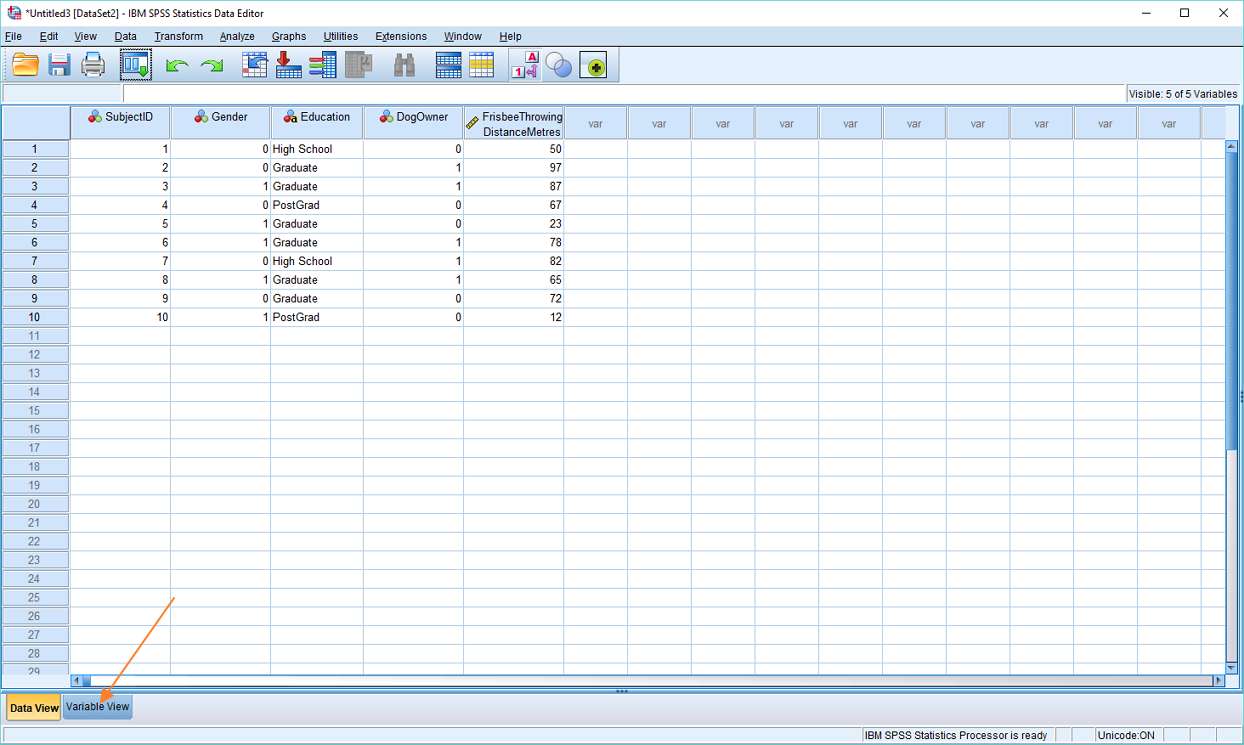
Obviously, the first thing to do here is to check that the data has come across successfully. If everything looks okay, the next stage is to check whether the various data parameters have been set correctly. Is numerical data correctly set as numerical, for example?
To check this, click on the Variable View tab (see red arrow, above). This will bring up the variable view within SPSS.
Variable View
As you can see from the image below, SPSS did a good job with our sample data, correctly identifying SubjectID, Gender, DogOwner and FrisbeeThrowing as data type numeric, and Education as data type string.
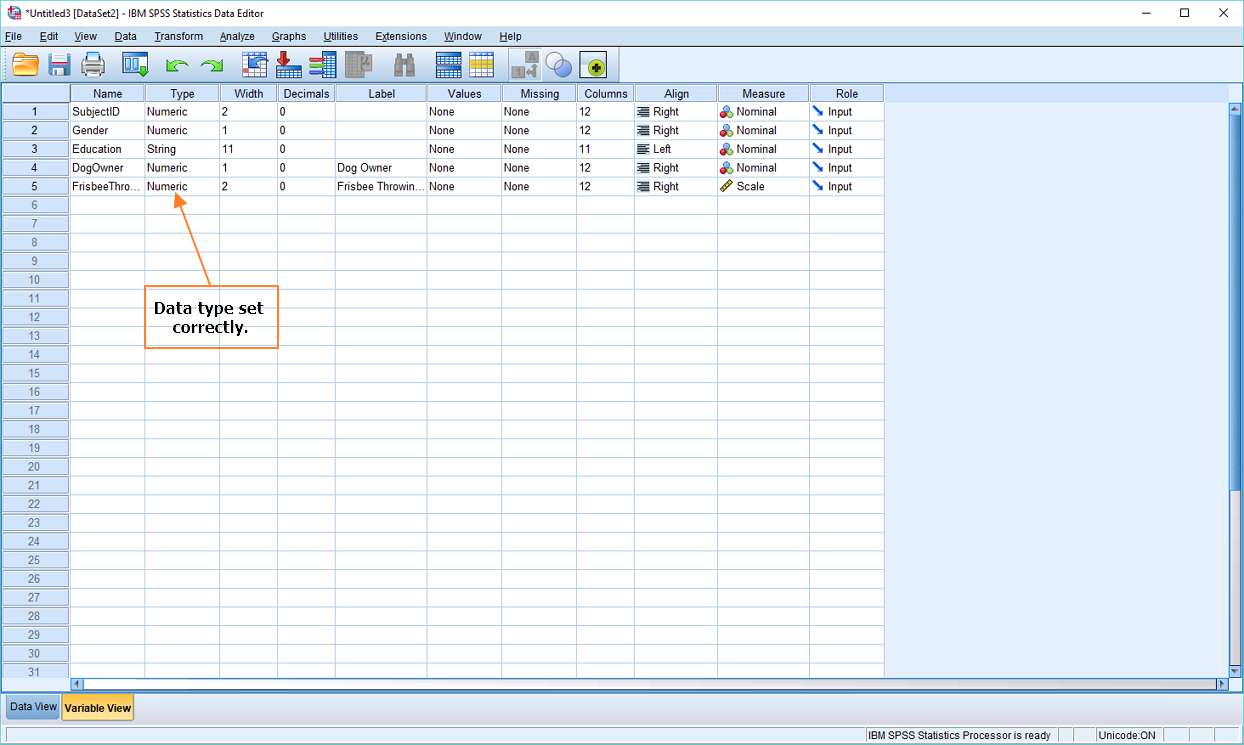
It also got level of measurement correct (see the Measure column), identifying SubjectID, Gender, Education and DogOwner as nominal data, and FrisbeeThrowing as scale (that is, as interval/ratio data).
***************
That’s pretty much it for this tutorial. You should now have a good idea of how to import data from Excel into the SPSS statistics package.
***************
EZSPSS on YouTube
Check out our YouTube channel for videos like the one below that covers the material in the above tutorial in slightly more detail: