This tutorial will introduce you to the Variable View tab in SPSS, and teach you how to define variables – that is, specify their various parameters – within this view.
Adding a Variable
In order to define a variable and set its parameters you need to get some data into SPSS. The easiest way is just to type it in. Select the Data View – click on the tab at the bottom of the program window – start in the first cell of an empty column, and work downwards. Let’s set up a variable for age by typing in five different ages (see screenshot below).
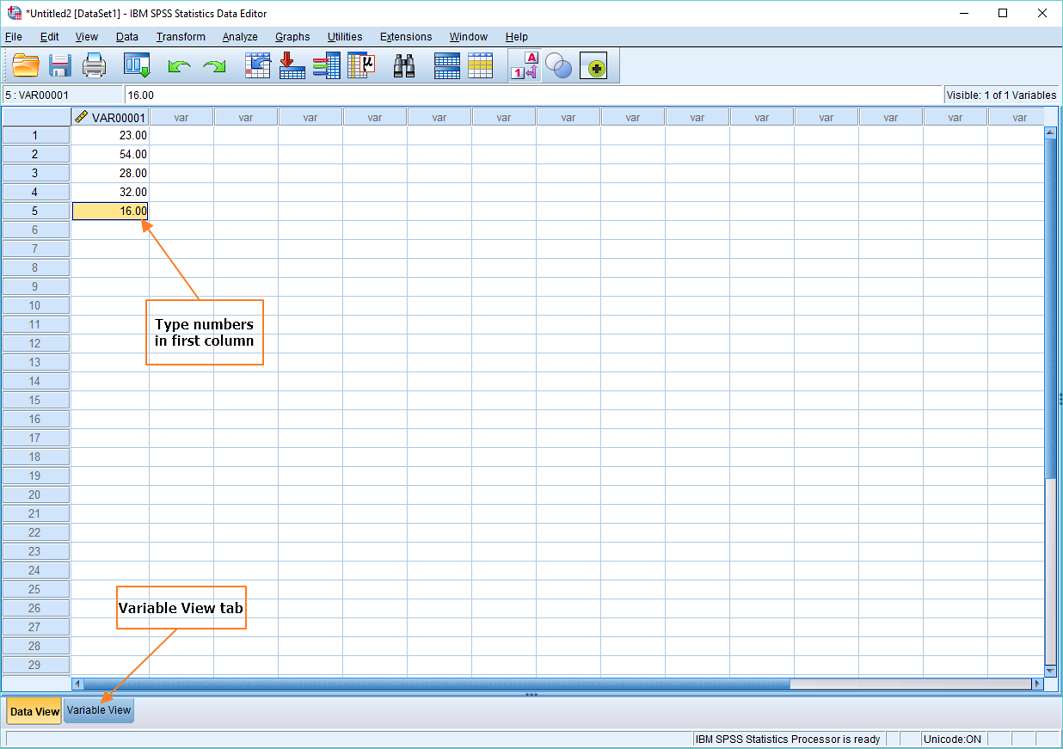
You can immediately see there’s a problem. The variable name is not informative (VAR00001) and the ages have decimal points. It’s possible to sort out both of these problems by switching to the Variable View (click the tab, as per the screenshot above), and specifying some of the parameters associated with the age variable.
Variable View
If you click on the Variable View tab, you’ll get a screen that looks like this.
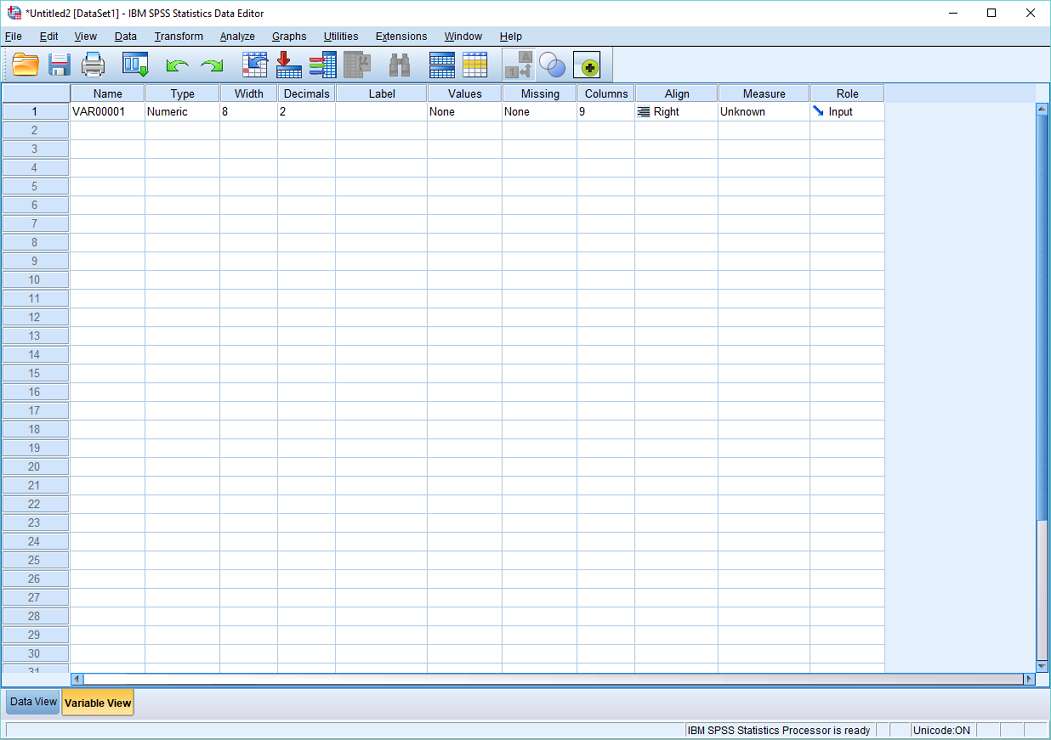
Each column (Name, Type, Width, etc) represents a parameter of the variable. And each row corresponds to a variable in the Data View. At the moment, we only have one variable, so there’s only one row.
To change the name of our variable to something meaningful, just click where it currently says VAR00001, and replace it with “Age”. You can also change the number of decimal places that are displayed in the Data View by clicking in the first cell of the Decimals column, and changing 2 to 0. If you click back to the Data View, you’ll see that things already look much better.
Variable Parameters
You now know how to change the Name and Decimals parameters. Here are the other parameters that can be specified and changed within the Variable View.
Type
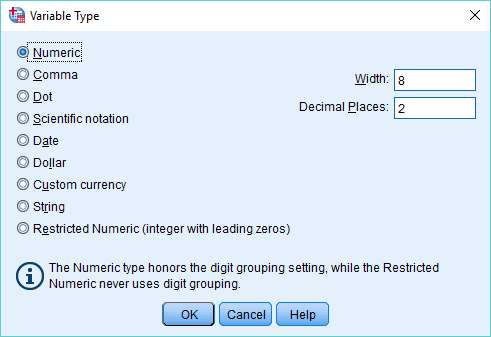
Type specifies the type of a variable, such as numeric, string, data, date, and so on. In our example, SPSS has correctly identified Age as a numeric type. If you need to change the type, click inside the cell you want to change (within the Type column, click again on the ellipsis if it appears), and a list of variable types will be displayed (as below). Select the variable type you require and click OK.
Width
This parameter relates to the number of digits or characters that are displayed for a particular variable within its column in the Data View.
Label
Label allows you to choose the text that is displayed in any SPSS output. For example, if you give the Age variable a label “Age Status”, then “Age Status” will appear on charts, graphs and tables. To add a label, click inside a cell within the Label column, and type in the value.
Values
This is a slightly complex issue, so it’s dealt with in a separate tutorial, which you should check out.
Missing
This parameter allows you to specify a code for missing values. You might get missing values if people refuse to answer a particular question on a questionnaire. To set a code for missing values, click in a cell within the “Missing” column (the cell row should correspond to the variable for which you wish to code missing values). Click on the ellipsis, and the following dialog box will appear.
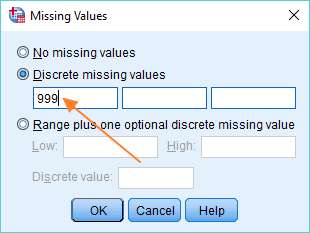
Select “Discrete missing values”, and input a value that doesn’t conflict with the data in your data set. We’ve entered 999, because nobody is 999 years old.
Columns
This parameter relates to the width of the column in the Data View grid. To increase or decrease the size of the column, click up or down on the arrow icon.
Align
This parameter relates to the alignment of values in the Data View grid. You can left justify, right justify or centre the data values within a column.
Measure
This parameter relates to the level of measurement of your data.
SPSS specifies three levels of measurement, nominal, ordinal or scale. You need to get this right. Select nominal if your values are categories (for example, sex, religion, disease, social class, species). Choose ordinal data if your values are a series of ranks, such as in the case of a motor racing result (first, second, third, fourth) or class standing. Select scale if your values are numerical, where each interval (for instance, 1 metre, 1 second, 1 inch) is the same size, no matter where it is located on the scale.
***************
That’s it for this tutorial. We hope you now have a decent understanding of how the Variable View works in SPSS, and how you go about defining a variable. Remember, you should check out our value labels tutorial to complete your survey of the Variable View.
EZSPSS on YouTube
This video tutorial uses a different data set, but covers the same material as above, and also includes a discussion of setting up value labels.