This tutorial will show you the quickest method to create a histogram in the SPSS statistical package.
Quick Steps
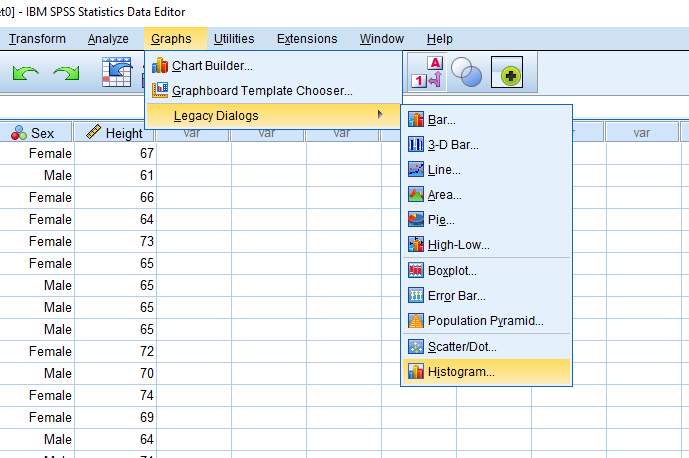
- Click Graphs -> Legacy Dialogs -> Histogram
- Drag variable you want to plot as a histogram from the left into the Variable text box
- Select “Display normal curve” (recommended)
- Click OK
- Histogram will appear in SPSS output viewer
The Data
As per usual with these quick tutorials, the starting assumption is that you have already imported data into SPSS, and you’re looking at something a bit like this.
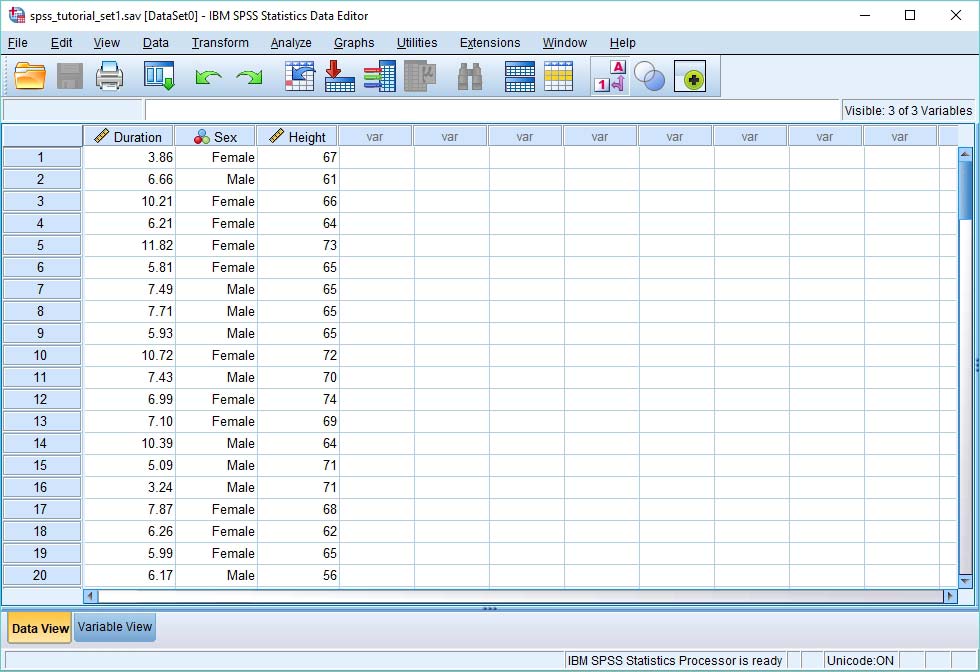
The variable we’re interested in out of the three you can see here is height. We want to know how the frequency of heights is distributed. For example, are there more heights at the top end than at the bottom end – in other words, is the distribution skewed? A histogram will go some way to answering this question.
Make a Histogram
The simplest and quickest way to generate a histogram in SPSS is to choose Graphs -> Legacy Dialogs -> Histogram, as below.
This brings up the following dialog box.
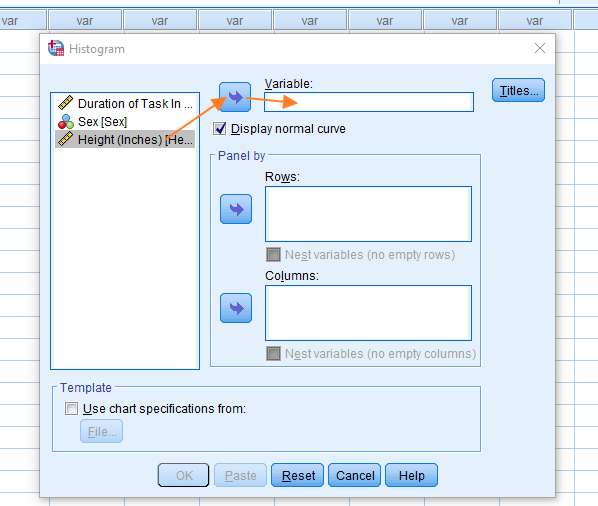
You need to select the variable on the left hand side that you want to plot as a histogram, in this case Height, and then shift it into the Variable box on the right. You can do this by selecting the variable, and then clicking the arrow (as above). We suggest you also tick the Display normal curve option, though this is optional. You’re now ready to create the histogram. Just press the OK button.
The Histogram
The SPSS output viewer will pop up with the histogram that you’ve created.

The y-axis (on the left) represents a frequency count, and the x-axis (across the bottom), the value of the variable (in this case Height). You’ll notice that SPSS also provides values for mean and standard deviation.
If you want to save your histogram, you can right-click on it within the output viewer, and choose to copy it to an image file (which you can then use within other programs). Alternatively, check out our tutorial on exporting SPSS output to other applications such as Word, Excel, or PDF.
***************
That’s it for this quick tutorial. You should now be able to create a histogram within SPSS using one of its legacy tools. You may find it easier, however, to create a histogram using the free Histogram Maker at StatsCharts.com
***************
EZSPSS on YouTube
If you prefer the spoken word over the written word, check out our YouTube channel, and this tutorial showing how to create a histogram in SPSS.