In this quick SPSS tutorial, we’ll look at how to calculate the Pearson correlation coefficient in SPSS, and how to interpret the result.
Quick Steps
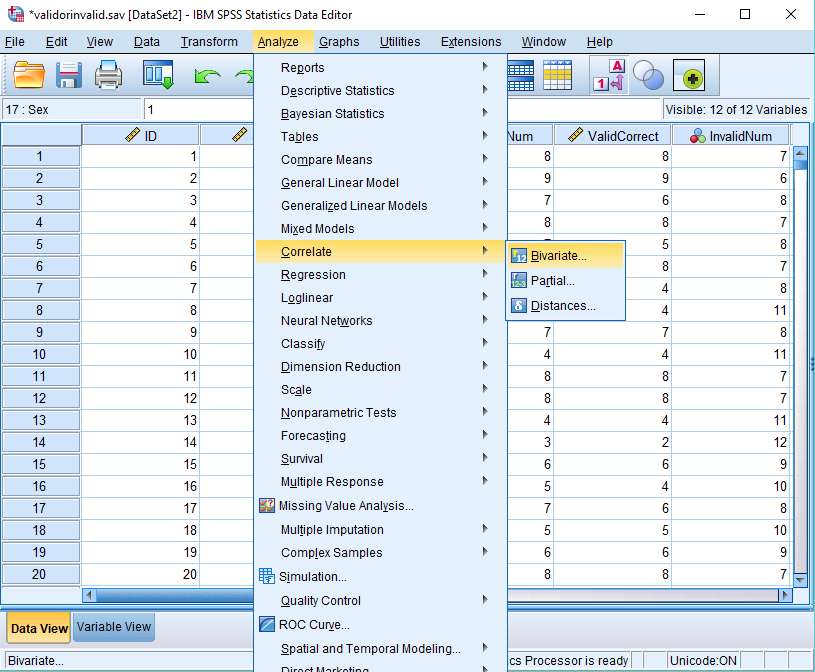
- Click on Analyze -> Correlate -> Bivariate
- Move the two variables you want to test over to the Variables box on the right
- Make sure Pearson is checked under Correlation Coefficients
- Press OK
- The result will appear in the SPSS output viewer
The Data
For the purposes of this tutorial, we’re using a data set that comes from the Philosophy Experiments website.
The Valid or Invalid? exercise is a logic test that requires people to determine whether deductive arguments are valid or invalid. This is the complete data set.
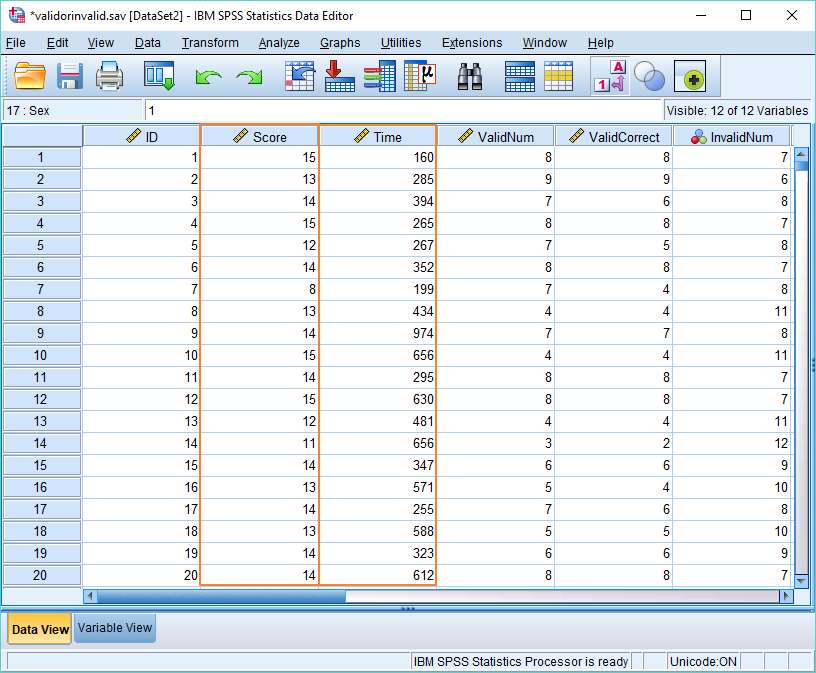
We’re interested in two variables, Score and Time.
Score is the number of questions that people get right. Time is the amount of time in seconds it takes them to complete the test. We want to find out if these two things are correlated. Put simply, do people get more questions right if they take longer answering each question?
Pearson’s correlation coefficient will help us to answer this question.
Pearson’s Correlation Coefficient
To start, click on Analyze -> Correlate -> Bivariate.
This will bring up the Bivariate Correlations dialog box.
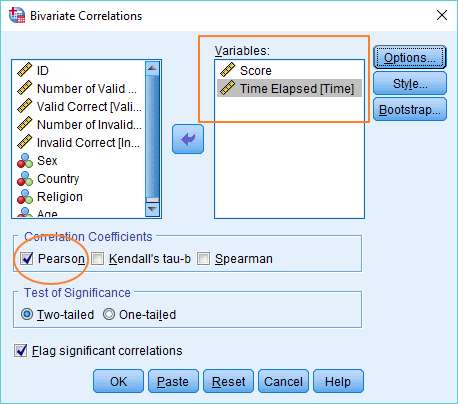
There are two things you’ve got to get done here. The first is to move the two variables of interest (i.e., the two variables you want to see whether they are correlated) into the Variables box on the right. You can do this by dragging and dropping (or using the arrow button in the middle).
The other thing is to ensure that “Pearson” is selected under Correlation Coefficients.
You can also select “Flag significant correlations”, though this is just optional.
That’s it. You’re set. Now just click OK.
The Result
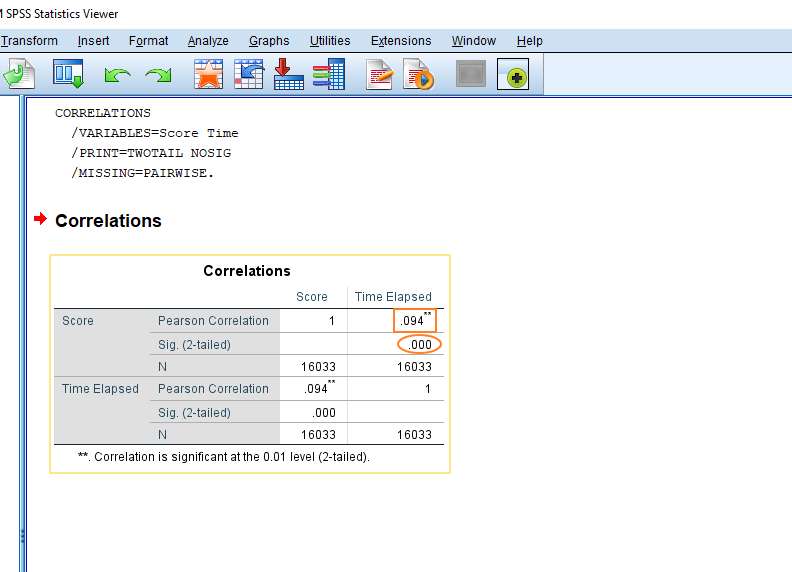
The first thing you might notice about the result is that it is a 2×2 matrix. This means, in effect, you get two results for the price of one, because you get the correlation coefficient of Score and Time Elapsed, and the correlation coefficient of Time Elapsed and Score (which is the same result, obviously).
We’re interested in two parts of the result.
Pearson’s r
The first is the value of Pearson’ r – i.e., the correlation coefficient. That’s the Pearson Correlation figure (inside the square red box, above), which in this case is .094.
Pearson’s r varies between +1 and -1, where +1 is a perfect positive correlation, and -1 is a perfect negative correlation. 0 means there is no linear correlation at all.
Our figure of .094 indicates a very weak positive correlation. The more time that people spend doing the test, the better they’re likely to do, but the effect is very small.
Significance
We’re also interested in the 2-tailed significance value – which in this case is < .000 (inside the red oval, above). The standard alpha value is .05, which means that our correlation is highly significant, not just a function of random sampling error, etc.
This seems counterintuitive. How can a very weak correlation be highly significant? How is it possible to be so confident that such a weak correlation is real?
The answer has to do with our sample size (see the figure for N, above). We have 16033 cases in our data set. This means that our study has enough statistical power to identify even very weak effects.
If the results from your study are not significant, your sample may not be big enough. Check out our tutorial on calculating sample size for a Pearson correlation.
***************
Right, we’ve come to the end of this tutorial. You should now be able to calculate Pearson’s correlation coefficient within SPSS, and to interpret the result that you get. You may also be interested in our tutorials on (1) exporting SPSS output to another application such as Word, Excel, or PDF and (2) reporting Pearson’s correlation coefficient from SPSS in APA style.