In this tutorial we show you how to compute and interpret Levene’s test for equality of variances in SPSS. Levene’s test assesses whether the variance of a dependent variable (e.g., exam scores) is equal for two or more groups (e.g., males and females). Equality of variances is also known as homogeneity of variances and it is an assumption of many statistical tests.
Quick Steps
- Ensure that your variables of interest are correctly defined in SPSS.
- Click Analyze -> Compare Means and Proportions -> One-Way ANOVA
- Click Reset (recommended)
- Move your dependent (continuous) variable to the Dependent List box
- Move your grouping (independent) variable to the Factor box
- Click Options
- Place a check in the Homogeneity of variance test checkbox
- Click Continue
- Click OK
Example
Our example data set contains the Research Methods exam scores of 60 fictitious students.
We’re planning to calculate a point-biserial correlation to assess the relationship between gender and the exam scores. One of the assumptions of this test is homogeneity of variances. In other words, the test assumes that the variance of a continuous variable (e.g., exam scores) is similar for both categories of a dichotomous variable (e.g., gender).
In order to test this homogeneity of variances assumption, we are going to compute Levene’s test in SPSS.
Setup in SPSS
Assuming that you have already imported your data into SPSS, you should be looking at something similar to our data set below.
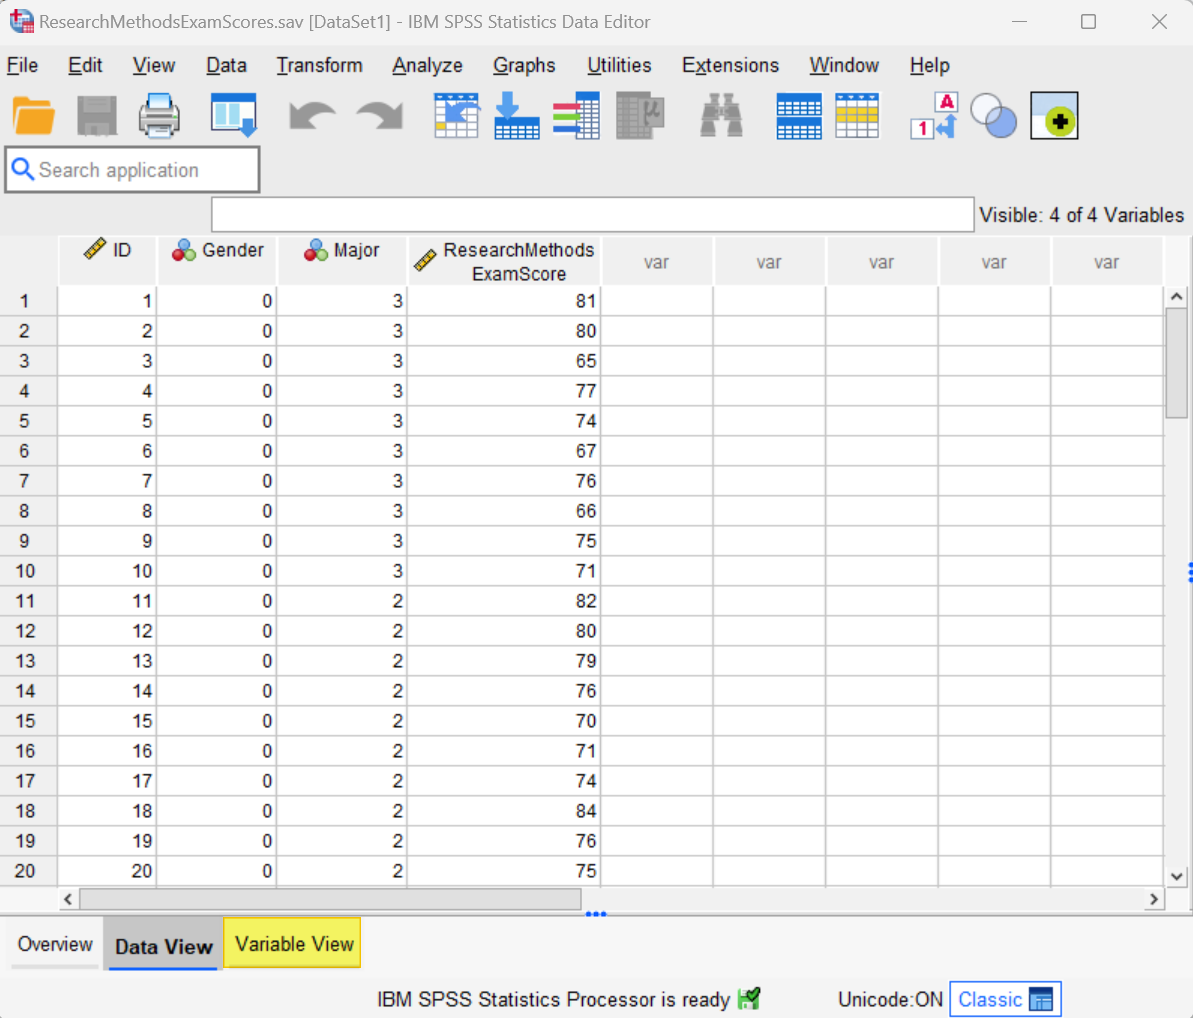
Note that we have coded the categorical grouping variable (gender) using the numeric codes 0 and 1. It is not possible to compute Levene’s test in SPSS if the categorical variable is coded as a string variable.
Please see our tutorial for a general overview of defining variables in SPSS. In the present tutorial we want to focus on the correct way to define your categorical grouping variable (e.g., gender) for Levene’s test in SPSS.
Start by clicking the Variable View tab (highlighted in the screenshot above). The screenshot below illustrates the Variable View for our data set.
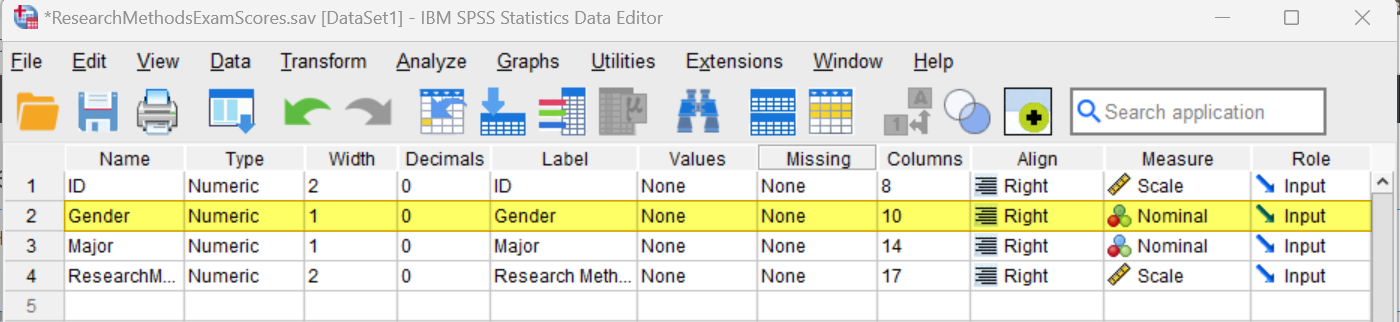
Type
The Type for your grouping (or independent) variable (e.g., gender) should be Numeric. If it isn’t, place your cursor, on the Type cell for the variable, then select the three dots on the right of the cell as illustrated below.
![]()
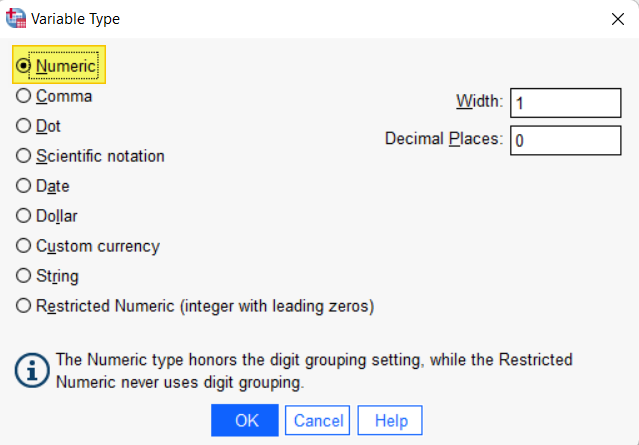
This brings up the Variable Type dialog box below. Select Numeric, then select OK.
Values
You will also need to define the values for your grouping (or independent) variable (e.g., gender). To do this, click on the Values cell for the variable, then select three dots at the right of the cell as illustrated below.
![]()
This brings up the Value Labels dialog box below:
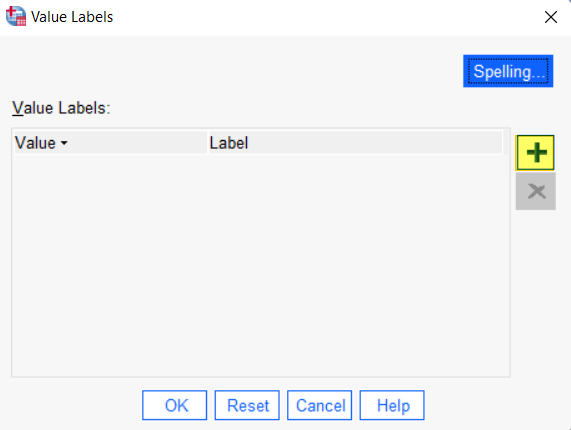
Click the [+] button highlighted above to add cells under Value and Label. In the cell under Value type your first value (“0” in our example). In the cell under Label type the label for that value (“Male” in our example).
Then, click the [+] button again and add your next value and label as above. Repeat these steps until you have added all of the value labels for your grouping variable as per our example below:
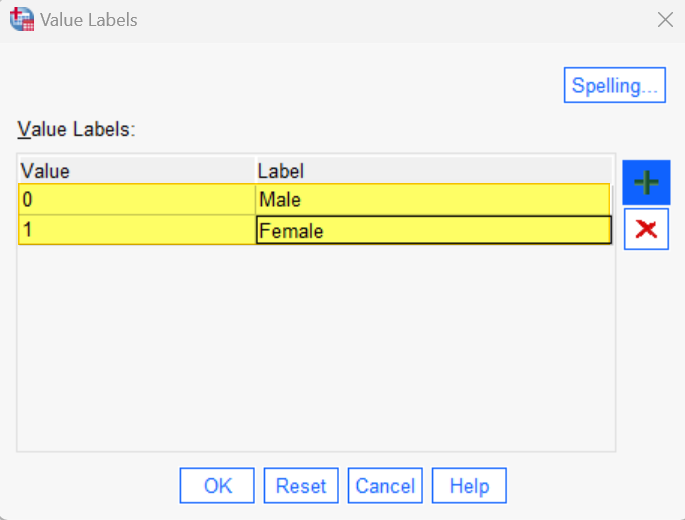
Select OK to save and close the Value Labels dialog box.
Measure
The Measure for your grouping variable should be Nominal. If the data for this variable has been imported into SPSS with the wrong level of measurement, place your cursor in the Measure field and select Nominal.
Levene’s Test
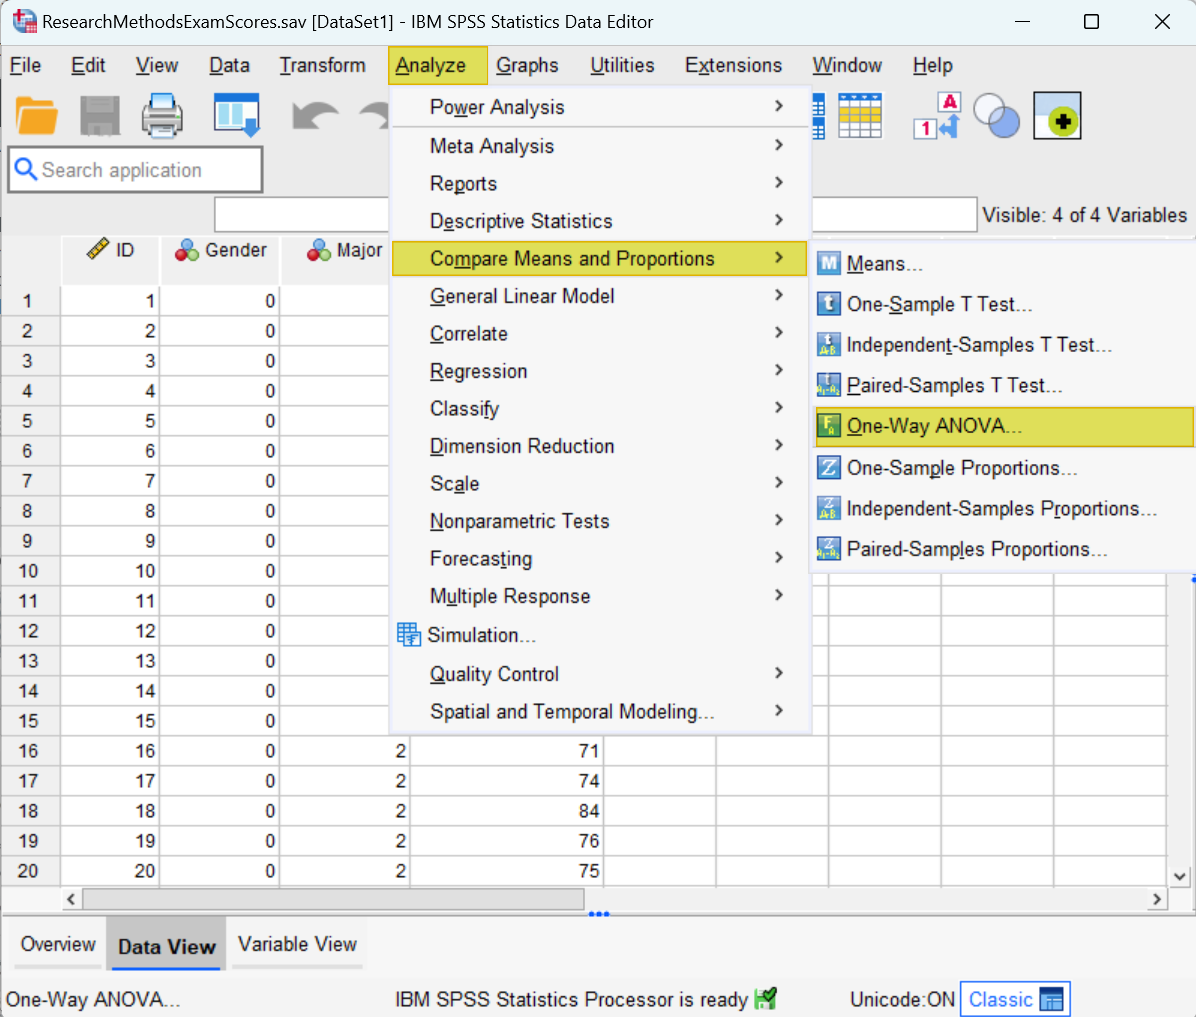
To compute Levene’s test in SPSS, first click Analyze -> Compare Means and Proportions -> One-Way ANOVA as illustrated below – don’t worry if you are not planning to use a one-way ANOVA to analyze your data:
This brings up the One-Way ANOVA dialog box illustrated below.
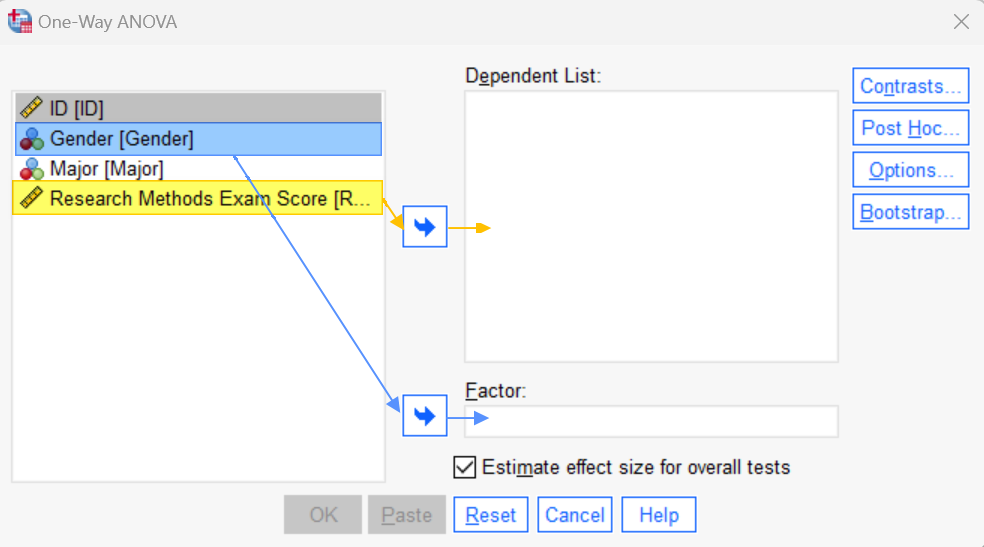
We recommend that you click the Reset button to clear any previous settings.
Select your dependent (continuous) variable (e.g., Research Methods exam scores) and use the arrow button to move it to the Dependent List box. Then, select your grouping (independent) variable (e.g., gender) and use the arrow button to move it to the Factor box.
Next, click the Options button. This brings up the One-Way ANOVA: Options dialog box.
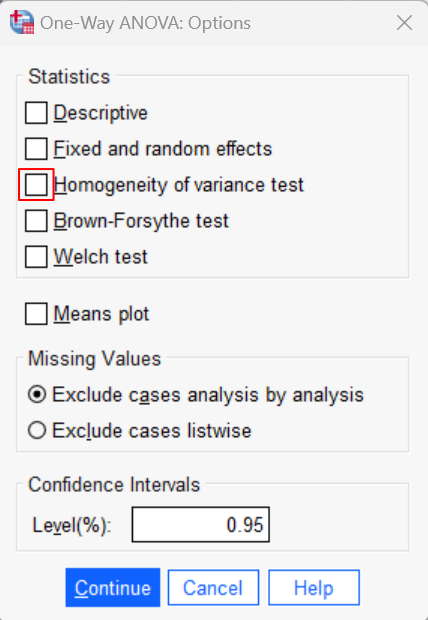
Place a check in the Homogeneity of variance test checkbox. Then, click Continue to return to the One-Way ANOVA dialog box.
Select OK. The SPSS Output Viewer will pop up with the results of your Levene’s test.
Results and Interpretation
You will find the results of your Levene’s test in the Test of Homogeneity of Variances table.
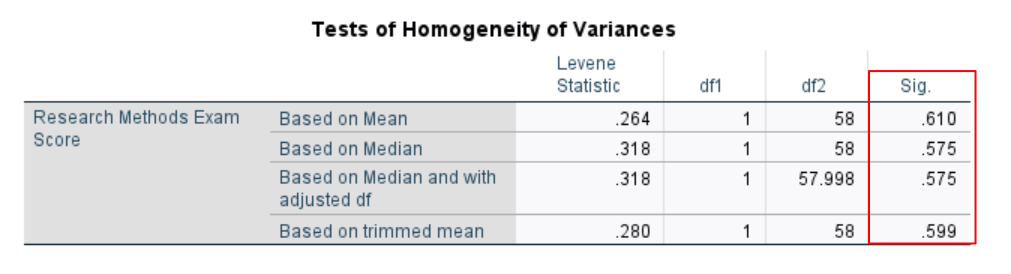
If the significance value for Levene’s test is greater than .05, as it is in the above table, we conclude that the equality of variances assumption is met. In other words, the variance of the dependent variable is similar between our groups. In our example, this means that the variance of Research Methods exam scores for male students is similar to the variance of Research Methods exam scores for female students.
On the other hand, if the significance value for Levene’s test is less than or equal to .05, then we conclude that the equality of variances assumption has been violated. In other words, the variances of the dependent variable differs between groups.
***************
That’s it for this tutorial. You should now be able to compute and interpret Levene’s test in SPSS.
***************