The point-biserial correlation is a special case of a Pearson correlation. It measures the strength and direction of the relationship between a dichotomous variable (e.g., pass or fail) and a continuous variable (e.g., exam scores). A dichotomous variable is a variable that has two values only, for example, male or female, pass or fail. In this tutorial, we show you how to calculate and interpret a point-biserial correlation in SPSS.
Quick Steps
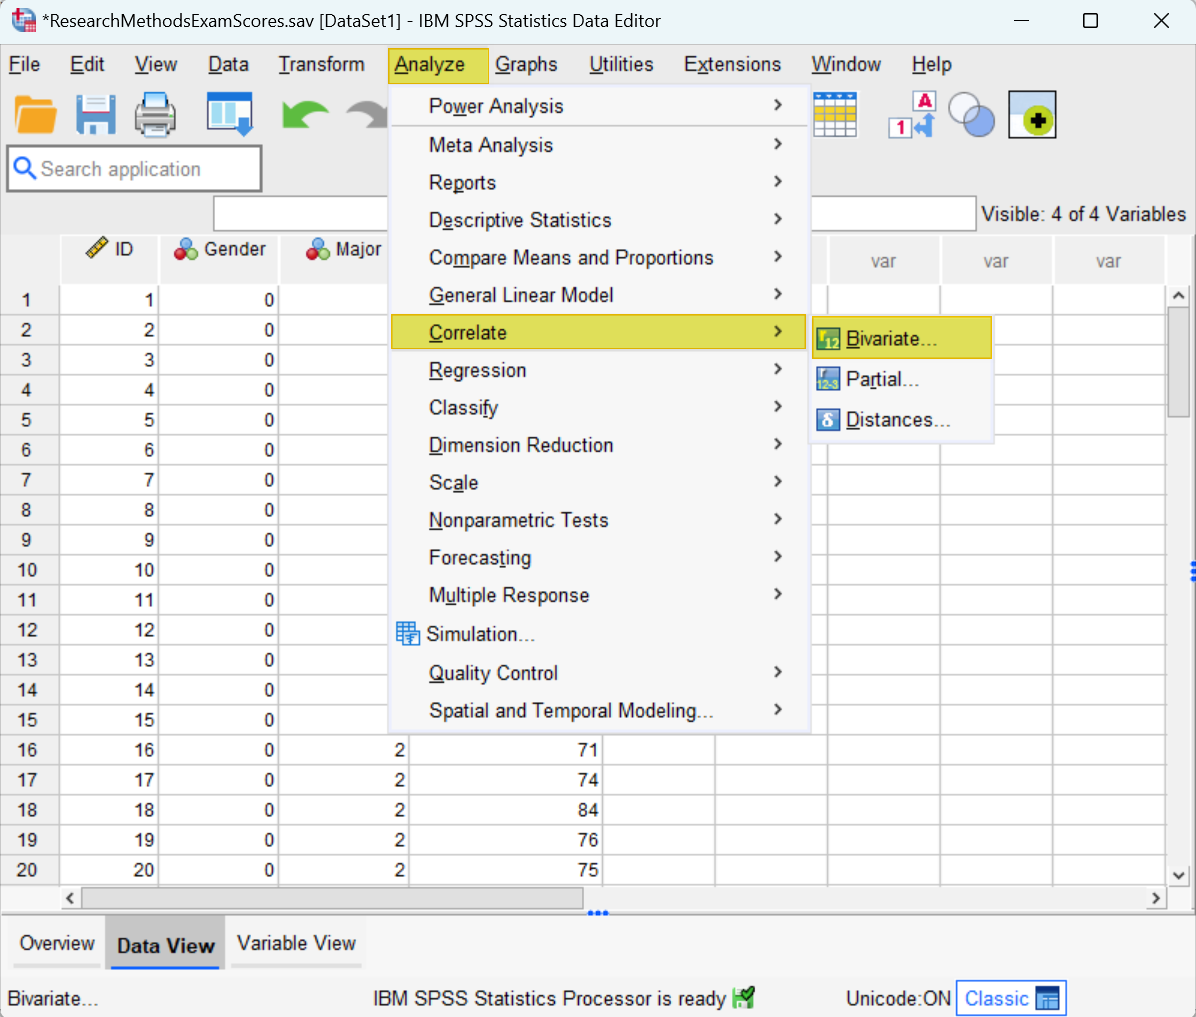
- Click Analyze -> Correlate -> Bivariate
- Click Reset (recommended)
- Move the two variables of interest to the Variables box on the right
- Ensure that the Pearson box is checked
- Ensure that the Flag significant correlations box is checked
- Place a check in the Show only the lower triangle box (recommended if available in your version of SPSS)
- Uncheck the show diagonal box (recommended if available in your version of SPSS)
- Click OK
Assumptions
Before you calculate a point-biserial correlation, you should ensure that your data meets the following assumptions, all of which you can check in SPSS:
- The continuous variable (e.g., exam scores) should be normally distributed for each category of the dichotomous variable (e.g., gender). See our tutorial on testing for normality in SPSS. Just remember to move your continuous variable to the Dependent List box and your dichotomous variable to the Factor List box.
- Homogeneity of variance. The variance of the continuous variable (e.g., exam scores) needs to be similar for both categories of the dichotomous variable (e.g., gender). You can check this assumption by computing Levene’s test in SPSS. Just remember to move your continuous variable to the Dependent List box and your dichotomous variable to the Factor box.
- The continuous variable has no outliers in either category of the dichotomous variable. You can check for outliers with boxplots using our side-by-side boxplots tutorial. Remember to move your continuous variable (e.g., exam scores) to the Variable box, and your dichotomous variable (e.g., gender) to the Category Axis box. Since you are creating boxplots to check for outliers only, you don’t need to worry too much about the other aspects of the boxplots that you generate.
Example
Our data set contains the Research Methods exam scores of 60 fictitious students.
We want to measure the strength and direction of any relationship that may exist between students’ gender (our dichotomous variable) and these exam scores (the continuous variable). To do this, we will calculate a point-biserial correlation in SPSS.
The Data
We start from the assumption that you have already imported your data into SPSS and that you’re looking at something like the data set below.
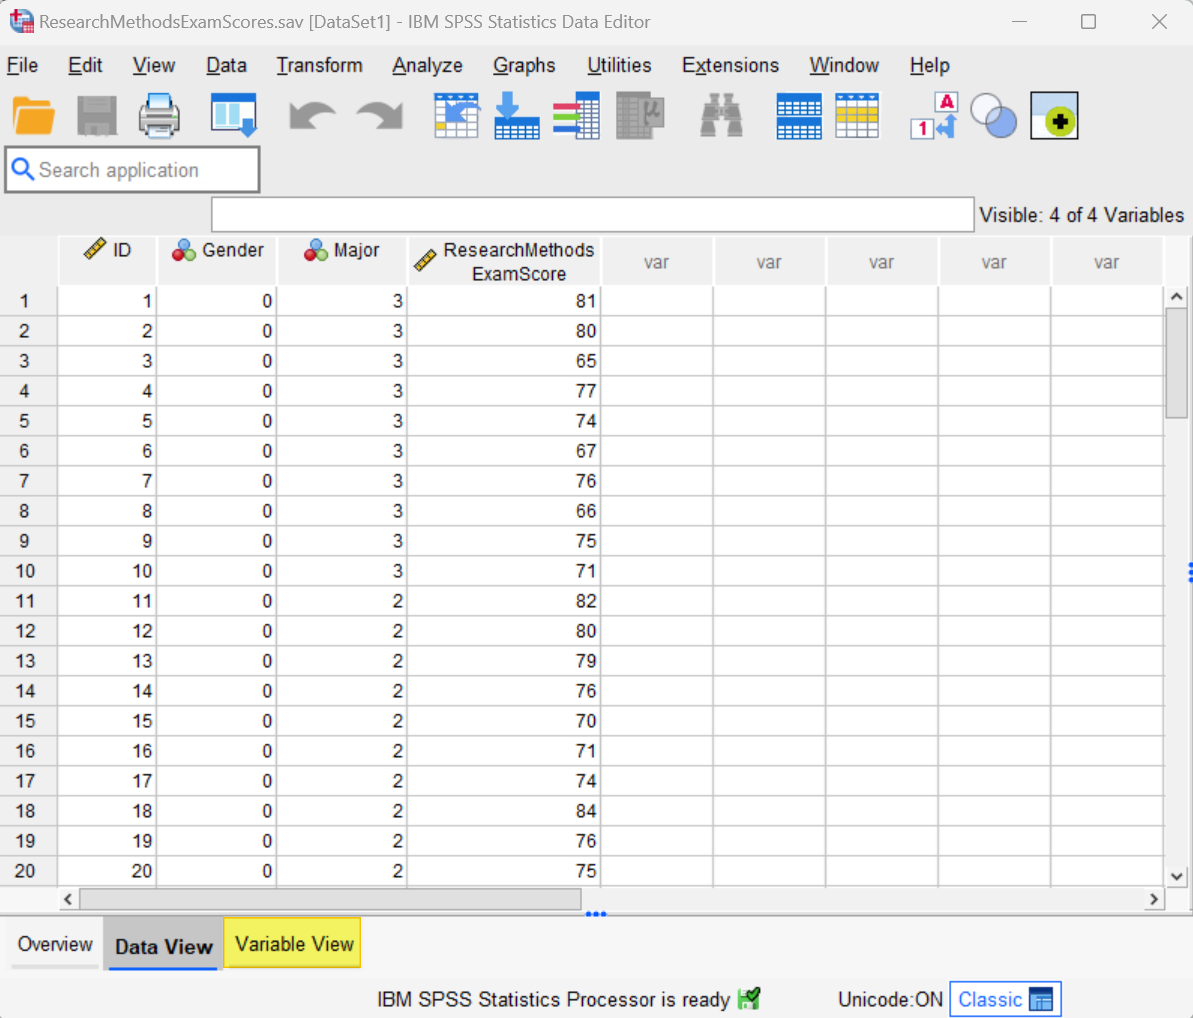
Note that we have coded our dichotomous variable (gender) using the numeric codes 0 and 1. It is not possible to compute a point-biserial correlation in SPSS if your dichotomous variable is coded as a string variable.
Please see our tutorial for a general overview of defining variables in SPSS. Here, we will simply outline the correct way to define your dichotomous variable (e.g., gender) for calculating a point-biserial correlation in SPSS.
To get started, click the Variable View tab (highlighted in the above screenshot). The Variable view for our data set is illustrated below, and our dichotomous variable is highlighted:
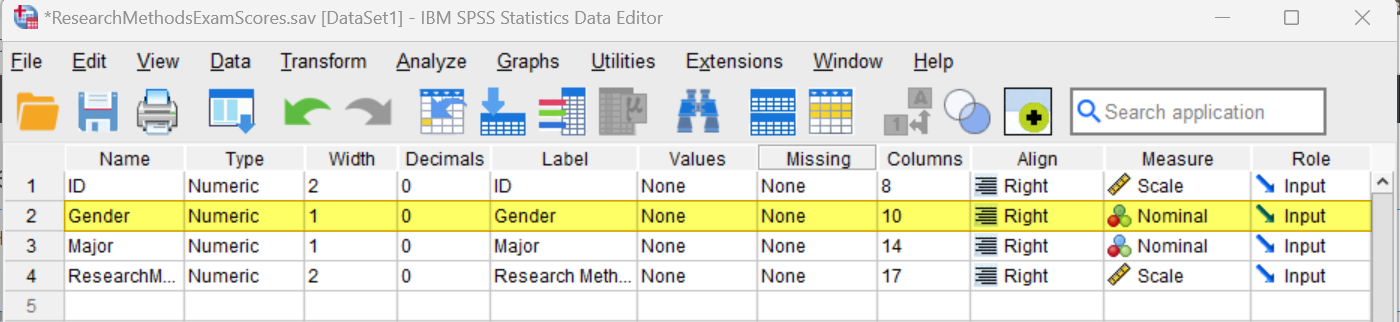
Type
The Type for your dichotomous variable (e.g., gender) should be Numeric. If it isn’t, place your cursor, on the Type cell for the variable, then select the three dots on the right of the cell as illustrated below.
![]()
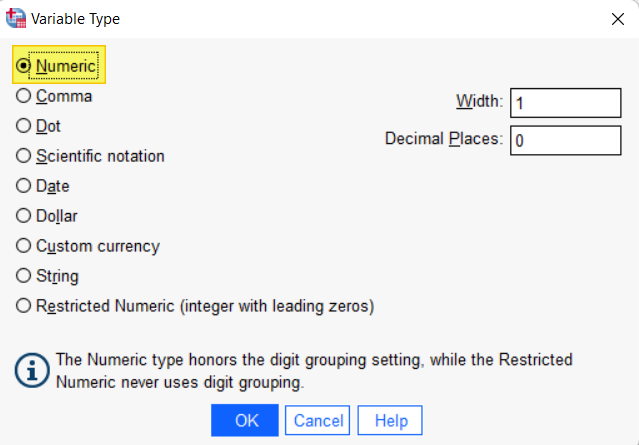
This brings up the Variable Type dialog box below. Select Numeric, then select OK.
Values
You will also need to define the values for your dichotomous variable (e.g., gender). To do this, click on the Values cell for the variable, then select three dots at the right of the cell as illustrated below.
![]()
This brings up the Value Labels dialog box below:
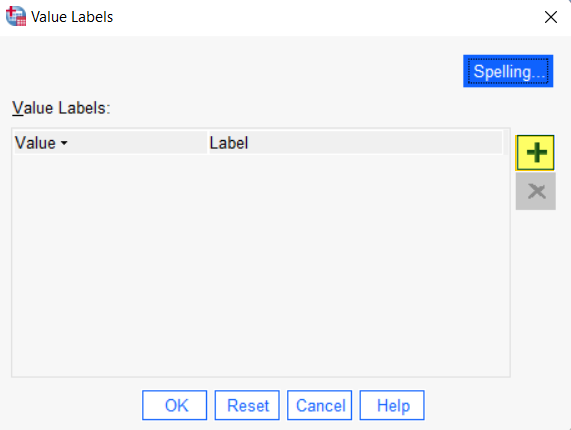
Click the [+] button highlighted above to add cells under Value and Label. The values for your dichotomous variable should be 0 and 1, so you will type “0” under Value. In the cell under Label, type the label for value “0” (“Male” in our example).
Then, click the [+] button again and type “1” under Value. In the cell under Label, type the label for value “1” (“Female” in our example). The Value Labels dialog box for your dichotomous variable should now look something like our example below:
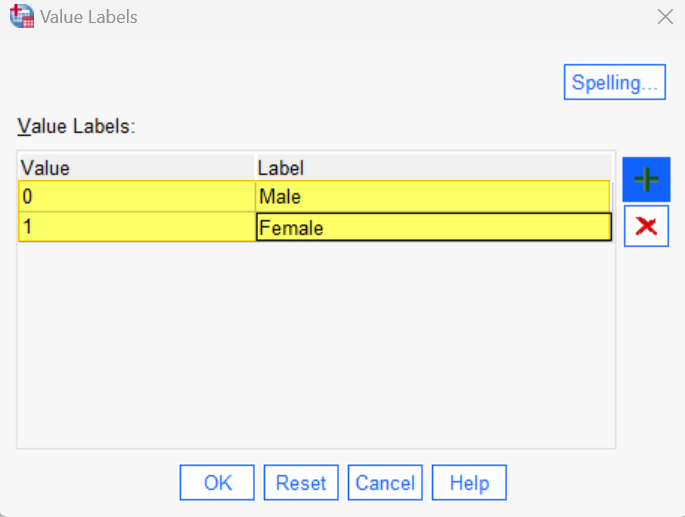
Click OK to save and close the Value Labels dialog box.
Measure
The Measure for categorical variables, including dichotomous ones, is Nominal. If the data for your dichotomous variable has been imported into SPSS with the wrong level of measurement, place your cursor in the Measure field and select Nominal.
Point-Biserial Correlation
To perform a point-biserial correlation in SPSS, start by clicking Analyze -> Correlate -> Bivariate
This brings up the Bivariate Correlations dialog box illustrated below. We recommend that you click the Reset button to clear any previous settings.
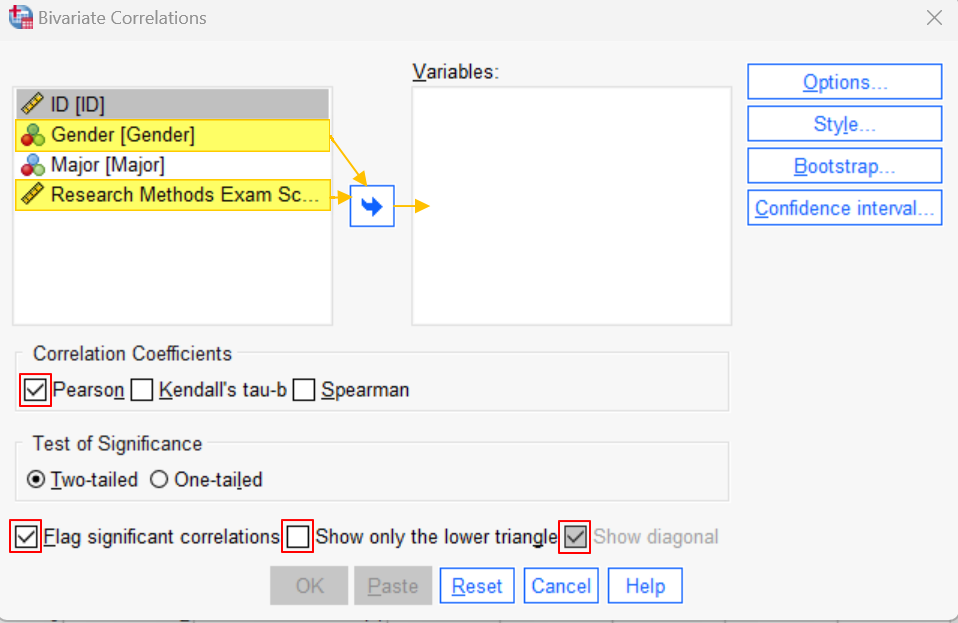
Next, holding down the CTRL key on your keyboard, select your two variables of interest (gender and Research Methods exam scores in our example), and use the arrow button to move them to the Variables box on the right of the dialog box.
In the area beneath “Correlation Coefficients”, make sure that the Pearson box is checked.
Ensure that the Flag significant correlations box is checked.
If the following options are available in your version of SPSS, we suggest checking the Show only the lower triangle box and unchecking the Show diagonal box. (Don’t worry if you don’t see these options). Your dialog box should now look something like the screenshot below:
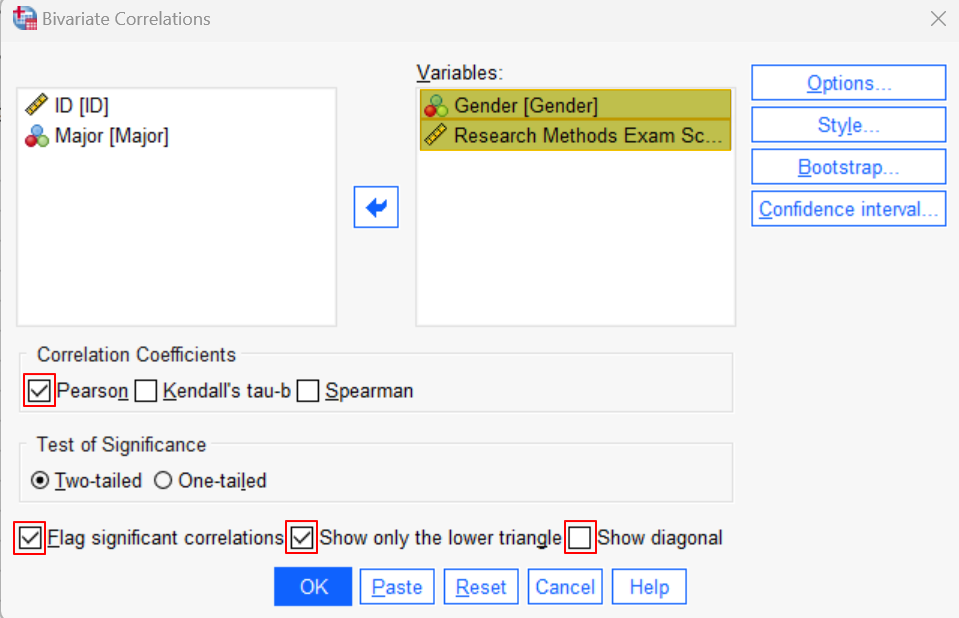
Click OK. The SPSS Output Viewer will appear with the results of your point-biserial correlation.
Results and Interpretation
You will find the results of the point-biserial correlation in the Correlations table. You will see the words “Pearson Correlation” in your table. Don’t worry about this! As noted at the beginning of this tutorial, a point-biserial correlation is a special case of a Pearson correlation.
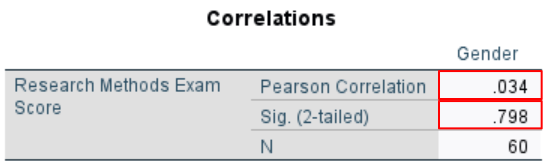
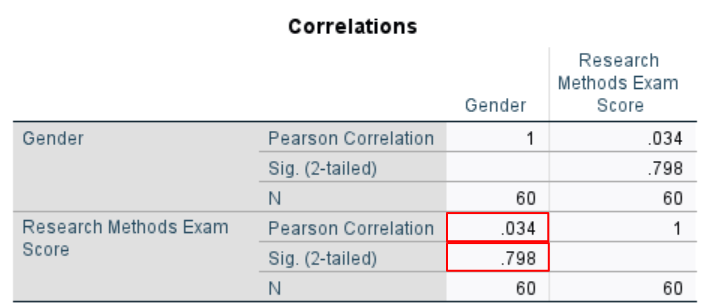
We are interested in two values in this table. The first of these is the correlation coefficient (Pearson Correlation) for our two variables. The second is the significance value (Sig. (2-tailed)). These values are identified in the screenshots below.
The first screenshot is how this table will look if you placed a check in the Show only the lower triangle box and unchecked the Show diagonal box when you were calculating the correlation. The second screenshot is how this table will look if you did not place a check in the Show only the lower triangle box.
Point-Biserial Correlation
The Pearson Correlation denotes the point-biserial correlation coefficient.
The range of possible values for the correlation coefficient is -1 to 1. -1 represents a perfect negative correlation between the two variables, and 1 represents a perfect positive correlation between them.
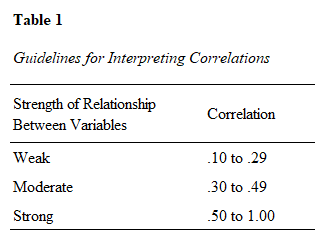
As illustrated, the value for our example is .034, a very weak positive correlation. A positive correlation means that as the value of one variable (gender) increases, the value of the other value (Research Methods exam scores) also increases. Since we coded male students as 0 and female students as 1, this means that there is a very weak positive correlation between being female and higher Research Methods exam scores.
Significance
The Sig. (2-tailed) value tell us whether or not our point-biserial correlation is significant. The correlation is significant if it is less than or equal to the alpha value that we selected for our study. We selected the standard alpha value of .05. Our significance value of .798 is much higher than .05, so we conclude that no significant correlation exists between gender and Research Methods exam scores in our study of fictitious students.
***************
That’s it for this tutorial. You should now be able to calculate and interpret a point-biserial correlation in SPSS. You may also be interested in our tutorial on reporting the results of a point-biserial correlation from SPSS in APA style.
***************