In this tutorial we will show you how to report a point-biserial correlation from SPSS in APA style.
First, we will provide two templates that you can use to report your point-biserial correlation in APA style. Then we will show you how to populate these templates using your SPSS output. Finally, we will show you two examples of point-biserial correlation reports, one written using each of our templates.
For more general information about formatting your reports in APA style, please refer to the APA Style website.
Templates for Reporting Point-Biserial Correlations in APA Style
We provide two templates for reporting a point-biserial correlation below.
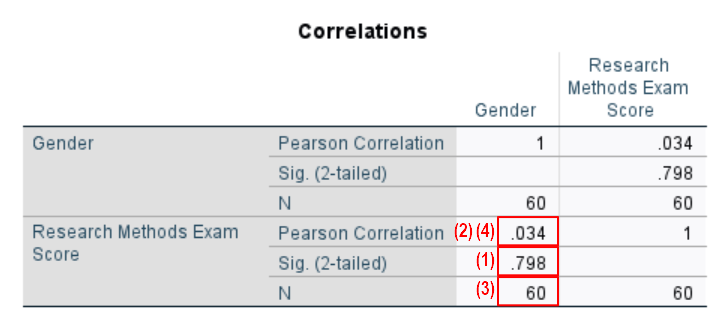
Use the first template if the relationship between your two variables is not significant. The relationship is not significant if the p value in the Sig. (2-tailed) row(s) of the Correlations table in the SPSS output (see (1) in the screenshot below) is greater than the alpha level you selected for your test. Selecting an alpha level of .05 is typical.
Use the second template if the relationship between your two variables is significant. The relationship is significant if the p value in the Sig. (2-tailed) row(s) of the Correlations table is less than or equal to the alpha level you selected for your test.
Replace the [blue text in square brackets] with information from your own point-biserial correlation. The (red numbers in parentheses) correspond to numbers on the screenshot of SPSS output below and/or to our notes and tips for writing your report (also below).
Template for Reporting a Point-Biserial Correlation: No Significant Relationship Between Variables
A point-biserial correlation was calculated to evaluate the relationship between [variable 1] and [variable 2]. The results indicated that the relationship between [variable 1] and [variable 2] was not significant, rpb([N(3)-2]) = [point-biserial correlation] (4), p = [value of p] (1).
Template for Reporting a Point-Biserial Correlation: Significant Relationship Between Variables
A point-biserial correlation was calculated to evaluate the relationship between [variable 1] and [variable 2]. There was a significant [direction of relationship] (2) relationship between [variable 1] and [variable 2], rpb([N(3)-2]) = [point-biserial correlation] (4), p = [value of p] (1). (5).
Populating the Point-Biserial APA Templates with Data from Your SPSS Output
Our screenshot comes from the SPSS output for a point-biserial calculation for a data set containing the gender and Research Methods exam scores of 60 fictitious students. We wanted to evaluate the relationship between students’ gender and these exam scores.
The numbers on the screenshot refer to the numbers in our APA templates above. Use the corresponding values from the SPSS output for your own point-biserial calculation to populate the relevant template.
Note that the screenshot for our point-biserial correlation below indicated that there was no significant relationship between our variables.
The APA Style Guide states that we should: (a) indent the first line of each of our paragraphs at a distance of 0.5 inches from the left margin; and (b) double-space our text.
We encourage you to tweak the wording of our templates as appropriate for your own study, and to ensure that your report communicates your results clearly.
(1) Report the p value to two or three decimal places as per the Sig. (2-tailed) row(s) of the Correlations table. If the p value is .000 however, report it as < .001. You should not add a leading zero to your p value.
(2) The relationship between your variables is positive if your point-biserial correlation as per the Pearson Correlation row of your Correlations table does not have a minus sign. The relationship is negative if it does have a minus sign. Note that, for some studies, it may be helpful to explain the direction of the correlation for your readers as outlined in (5) below.
(3) The value in the parentheses after rpb is N-2, the degrees of freedom (df) for your point-biserial correlation. You will find N (the number of subjects in your sample) in the Correlations table. In our example, N = 60, so the df is 58.
(4) Report the value of your point-biserial correlation from the Pearson Correlation row(s) of the Correlations table to two decimal places. You should not add a leading zero to your correlation.
(5) If the direction of your point-biserial correlation isn’t easy for your reader to understand, we recommend that you explain it. For example, what do we mean when we say that there is a significant positive correlation between a students’ score for their photography project and their gender? Do the male students score higher or do the female students score higher?
If you have generated descriptive statistics for your study, you could refer to these to see whether male or female students received higher mean scores. If you have not generated descriptive statistics, however, you can interpret the direction of your correlation using the table below:
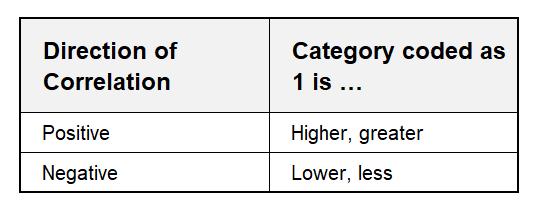
So, if we had coded females as 1, and the correlation was positive, it would mean that the scores of female students were higher than those of males. On the other hand if this correlation was negative, it would mean that the scores of female students were lower than those of their male counterparts.
Examples of Point-Biserial Correlation Reports Written in APA Style
Point-Biserial Correlation: No Significant Relationship Between Variables
A point-biserial correlation was calculated to evaluate the relationship between [students’ Research Methods exam scores] and [their gender]. The results indicated that the relationship between [Research Methods exam scores] and [gender] was not significant, rpb([58]) = [.03], p = [.798].
Point-Biserial Correlation: Significant Relationship Between Variables
A point-biserial correlation was calculated to evaluate the relationship between [students’ scores for their Photography project] and [their gender]. There was a significant [positive] relationship between [students’ scores] and [their gender], rpb([28]) = [.37], p = [.014]. The photography project scores for female students were significantly higher than those for their male counterparts.
***************
That’s it for this tutorial. You should now be able to report the results of a point-biserial correlation from SPSS in APA style.
***************