In this quick tutorial, we will show you how to conduct and interpret a Wilcoxon signed-rank test in SPSS.
Quick Steps
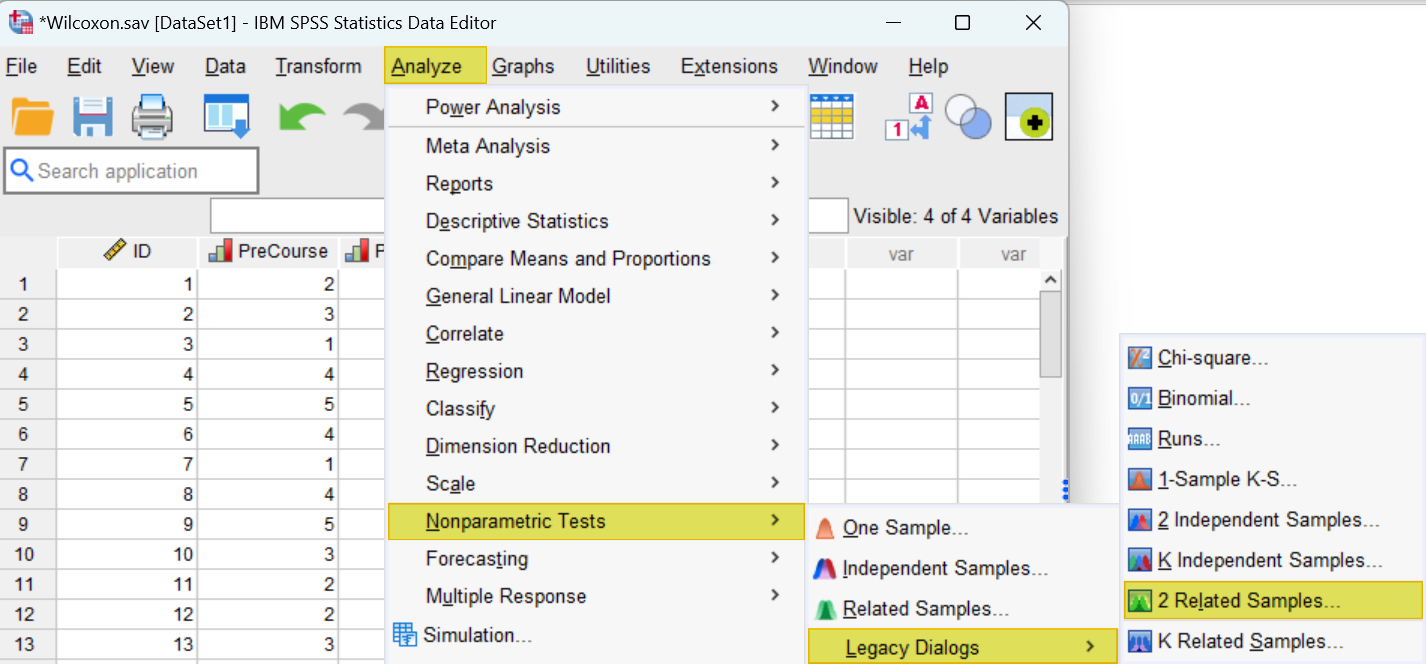
- Click Analyze -> Nonparametric tests -> Legacy Dialogs -> 2 Related samples…
- Click Reset (recommended).
- Move your first variable to the Variable1 cell of the Test Pairs box
- Move your second variable to the Variable2 cell of the Test Pairs box.
- Under “Test Type” ensure that the Wilcoxon box is checked.
- Click Options (recommended)
- Check the Quartiles box (recommended)
- Click Continue (recommended)
- Click OK.
The Wilcoxon signed-rank test is used to evaluate whether there is a significant difference between two sets of scores taken from the same participants. It can be used to compare the scores of a group of participants taken before and after an intervention. For example, we could use it to compare students’ confidence in their ability to manage their personal finances before and after completing a personal finance course.
It can also be used to compare the scores of the same group of participants under two different conditions. For example, we could use it it to test participants’ problem-solving abilities in rooms at two different temperatures.
The Wilcoxon signed-rank test is a non-parametric alternative to the paired samples t test. Unlike the paired samples t test, it can be used to analyze ordinal data as well as continuous data, and it does not assume that your data is normally distributed.
Assumptions of the Wilcoxon Signed-Rank Test
The assumptions of the Wilcoxon signed-rank test are as follows:
- Your independent categorical variable has two levels. For example, pre-test and post-test.
- Your dependent variable is measured at the ratio, interval or ordinal level. Examples of variables measured at these levels are: body weight (ratio data), temperature (interval data), and Likert scale responses (ordinal data).
- The two sets of scores on the dependent variable (one for each level of the independent variable) come from the same participants.
- Each pair of observations is random and independent.
- The distribution of difference scores is symmetrical. That is, if we compute the differences between each pair of scores, the distribution of those difference is approximately symmetrical. We will show you how to test this assumption below.
The Data
We start from the assumption that you have entered or imported your data into SPSS; that you have defined your variables as needed; and that you’re looking at something like the following.
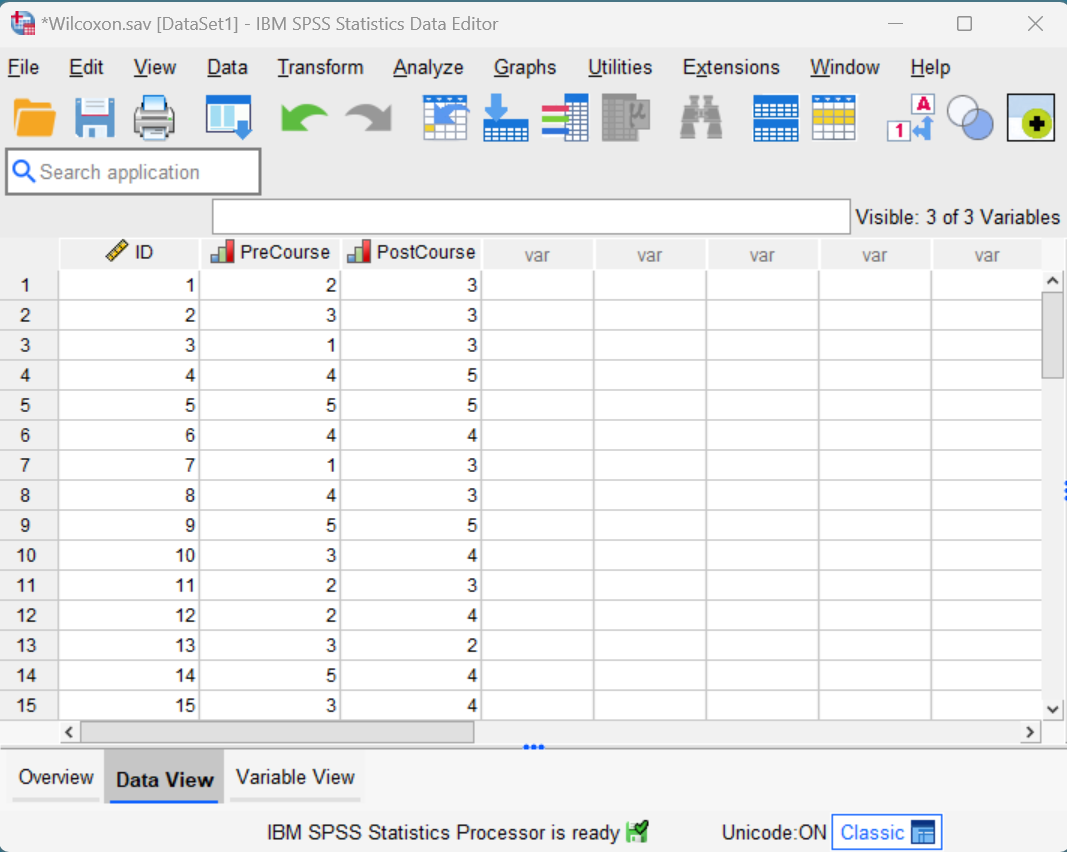
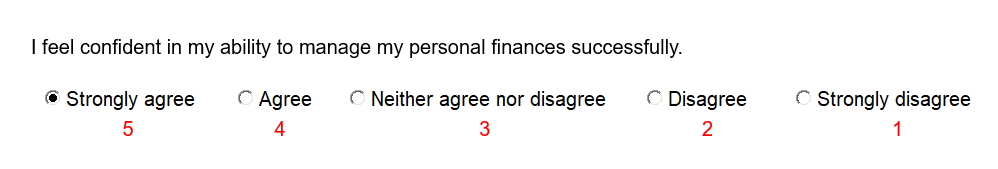
Our data set contains the responses of 30 fictitious students who were asked to indicate their level of agreement or disagreement with the Likert scale statement below. Their responses were recorded both before they completed a personal finance course and again after completing the course. As you can see, the more they agree with this statement, the higher their score.
We want to find out whether there is a significant difference in students’ confidence in their ability to manage their personal finances successfully before and after completing this course. Since it isn’t appropriate to run a paired samples t test on ordinal data like Likert scale responses, we will use a Wilcoxon signed-rank test to analyze our data.
Symmetrical Distribution of Difference Scores Assumption
As noted above, the Wilcoxon signed-rank test assumes that the distribution of the differences between the paired scores is symmetrical. To test this assumption, we need to: (1) compute the difference scores; and (2) visualize and review the distribution of these difference scores using a boxplot.
Computing Difference Scores in SPSS
Please follow the steps in our linked tutorial to compute the differences scores for the paired variables in your data set. Once you do this, you will see an additional column containing these difference scores as illustrated for our data set below.
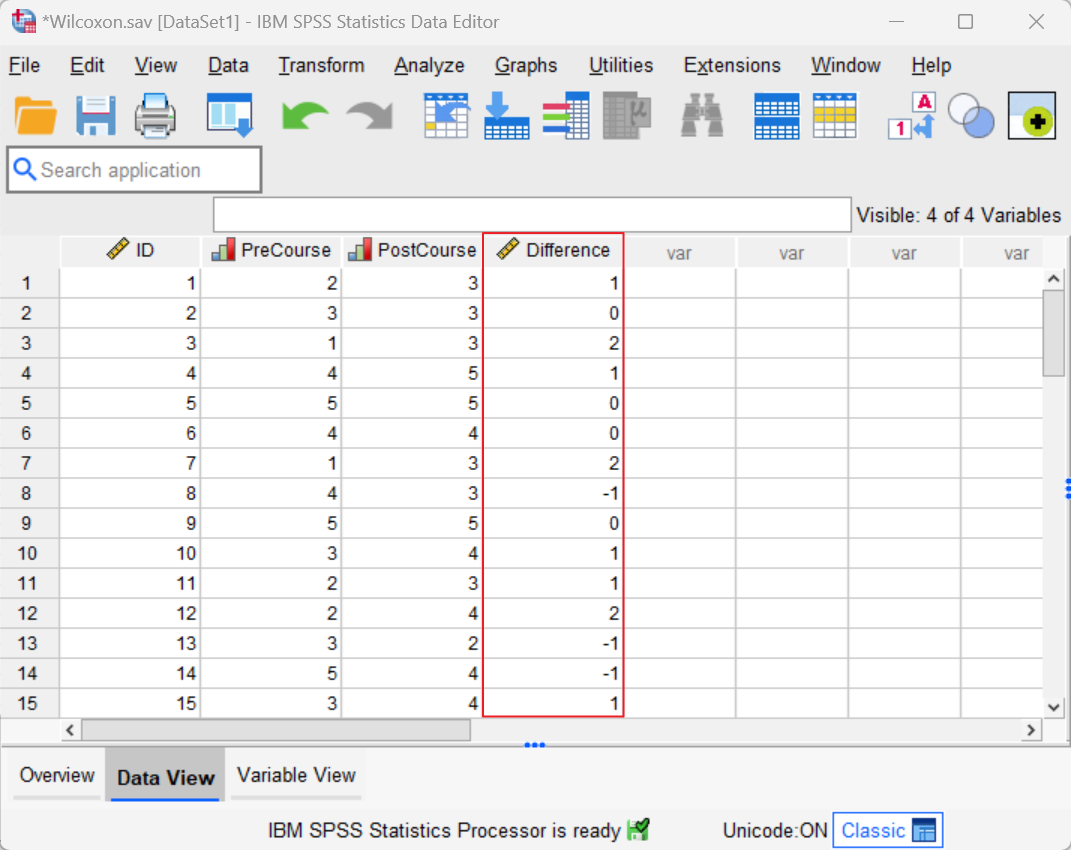
We can see, for example, that participant 1 scored 2 (disagree) before they completed the personal finance course, and 3 (Neither agree nor disagree) after completing this course. This means that their difference score is 1 (3 minus 2).
Creating a Boxplot to Review the Distribution of Difference Scores
Next, we need to create and review a boxplot of our difference scores to see whether the distribution of these scores is symmetrical. The boxplot for our example data is illustrated below:
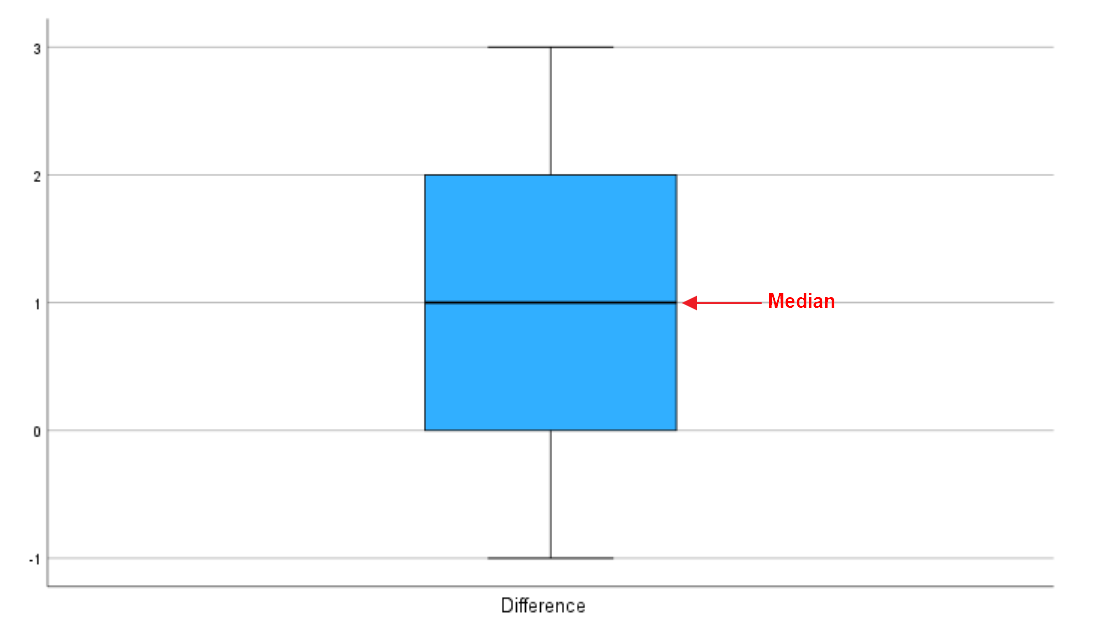
If the difference scores are symmetrical, the areas above and below the median line of the box will be about the same size, and the whiskers at each end of the box will be approximately the same length. The boxplot for the difference scores for our example appears to indicate that the distribution of these scores is roughly symmetrical.
Wilcoxon Signed-Rank Test
You can perform a Wilcoxon signed-rank test in SPSS by completing the following steps.
First, click Analyze -> Nonparametric tests -> Legacy Dialogs -> 2 Related samples… as illustrated below:
This brings up the Two-Related-Samples Tests dialog box illustrated below. We recommend that you click the Reset button to clear any previous settings before proceeding.
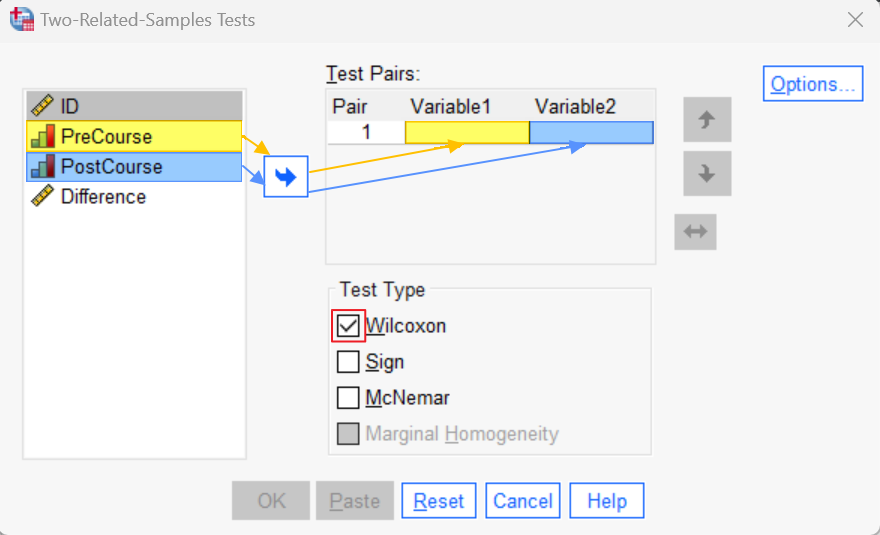
Next, select the first variable of your pair (“PreCourse” in our example), and use the arrow button to move it to the Variable1 cell of the Test Pairs box. Then, select the second variable of your pair (“PostCourse” in our example), and use the arrow to move it to the Variable2 cell of the Test Pairs box.
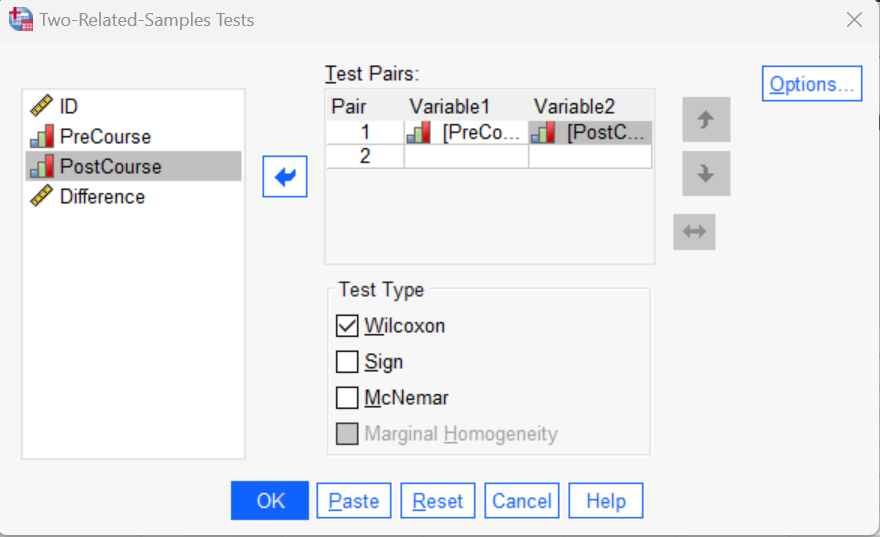
Under “Test Type” ensure that the Wilcoxon box is checked. Your dialog box should now look something like the following:
We recommend that you compute the medians for your paired variables. To do this, start by clicking the Options button. This brings up the Two-Related-Samples: Options dialog box.
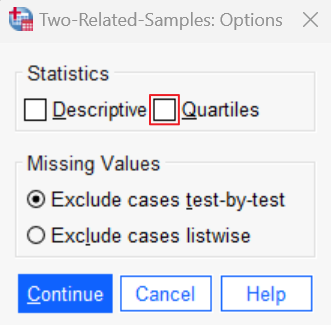
Check the Quartiles box, then click the Continue button to return to the main Two-Related-Samples Tests dialog box.
Click OK. The SPSS Output Viewer will pop up with the results of your Wilcoxon signed-rank test.
Results and Interpretation
If you computed medians for your paired variables as per our recommendation, you will see a Descriptive Statistics table containing this information in the SPSS Output Viewer.
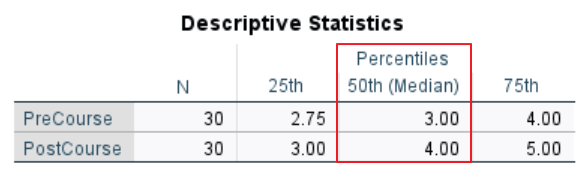
For our fictitious example, we can see that students had a median Likert scale response of 3 before they completed the personal finance course. After they completed this course, however, the same students had a median Likert scale response of 4. This indicates that their confidence in their ability to manage their personal finances successfully increased after they completed this course.
To find out whether the difference between the medians for our pair of variables is significant, we need to review the Test Statistics table in the SPSS Output Viewer.
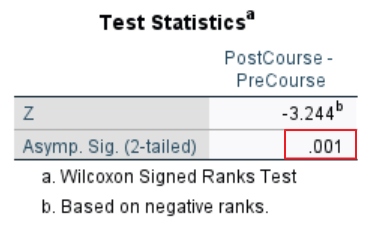
If the p value in the Asymp. Sig. (2-tailed) row of this table is less than or equal to the alpha level you are using for your Wilcoxon signed-rank test, then the difference between the medians is significant. We are using the standard alpha level of .05. Our p value of .001 is less than .05, so it significant. In other words, students expressed significantly more confidence in their ability to manage their personal finances successfully after they completed the personal finance course than before they completed it.
***************
That’s it for this tutorial. You should now be able to conduct and interpret a Wilcoxon signed-rank test in SPSS. You may also be interested in our tutorial on reporting a Wilcoxon signed-rank test from SPSS in APA style.
***************