In this tutorial, we will show you how to clean your data in SPSS.
What is Data Cleaning?
Data cleaning is the process of reviewing a data set for potential problems and resolving those problems prior to data analysis. Data problems include incomplete, incorrect, or incorrectly formatted data.
Why is Data Cleaning Important?
The results of our data analysis are only as good as the quality of our data. If we analyze “dirty” data, our results will not be reliable, and the conclusions we draw from our study may be incorrect.
Data cleaning allows us to remove or minimize data problems before we perform data analysis, allowing us to draw more accurate insights from our data.
Preparing to Clean Your Data in SPSS
After we have entered or imported our data into SPSS, we need to create a backup of our data set. We also need to ensure that each case in our data set has a unique ID. Finally, we need to prepare to document our data cleaning process.
Creating a Backup of Your Data Set
It is important to create a backup of your data set before you start cleaning it. You will then be able to revert to the original data set if you incorrectly alter or delete any of the data during the data cleaning process.
Ensuring Each Case Has a Unique ID
Each case (record or row) in your data set should have a unique identifier that determines the correct order of the data set. This is important because some data cleaning techniques require that we sort our data in a different way. Having a unique ID allows us to return the cases to their original order.
Preparing to Document Your Data Cleaning Process
It is important to document your data cleaning process as you go along so that you can communicate it to your audience when you report the results of your study.
Data Cleaning in SPSS
There are several different data cleaning techniques that we can perform in SPSS, not all of which are applicable to every data set. In this tutorial, we cover some of the most common and useful techniques. These involve the management of: structural errors, out of range values, outliers, and missing values.
Structural Errors
Structural errors include typos, inconsistent capitalization, and inconsistent naming conventions in categorical (or qualitative) variables.
These errors may cause problems when we analyze our data. For example, if we enter a participant’s gender as “F” rather than “Female” for some of the cases in a data set, SPSS will treat “F” and “Female” as different gender categories,” leading to errors in our data analysis.
Identifying Structural Errors in SPSS
To identify structural errors in SPSS, click Analyze -> Descriptive Statistics -> Frequencies.
This brings up the Frequencies dialog box below. We recommend that you click Reset to clear any previous settings before proceeding.
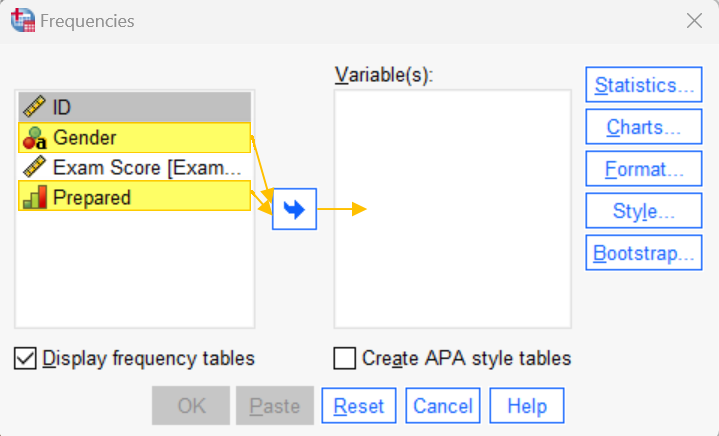
Select the first categorical variable in your data set. Then, holding down the CTRL key on your keyboard, select the other categorical variables, and use the arrow button to move them to the Variable(s) box.
Click OK. The SPSS Output Viewer will pop up with a frequency table for each of your selected variables. Review these to see whether any of your variables contain unexpected values or structural issues.
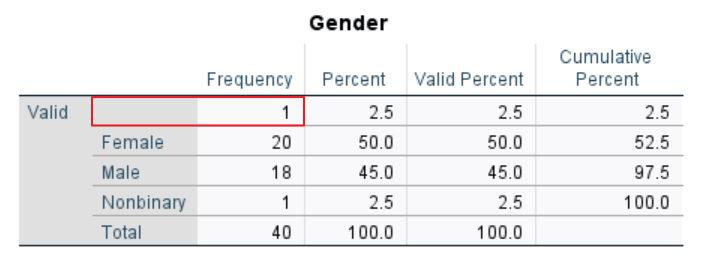
The frequency table for our gender variable reveals two structural issues.
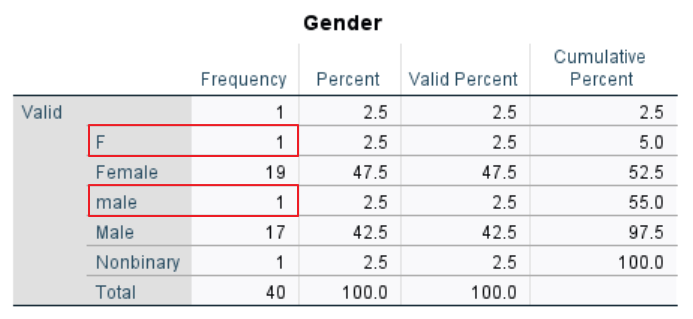
The first issue is that the gender of one participant has been entered as “F” instead of “Female.” The second issue is that “male” (with a lower case “m”) has been entered instead of “Male” for another participant. We need to correct these issues so that SPSS does not treat “F” and “male” as distinct categories.
Note that the absence of a value in the first row of the table indicates a missing value. We address this topic later in the tutorial.
Correcting Structural Errors in SPSS
To correct the structural issues we have identified, we first need to sort our data using that variable.
In the SPSS Data Viewer, right-click on the name of the variable of interest (e.g., “Gender”). Select Sort Ascending or Sort Descending as applicable. Our sorted data set is illustrated below.
Important: Once you sort your data in SPSS, you cannot undo it. However, if you include a unique identifier in your data set, you can use it to return your data set to its original order.
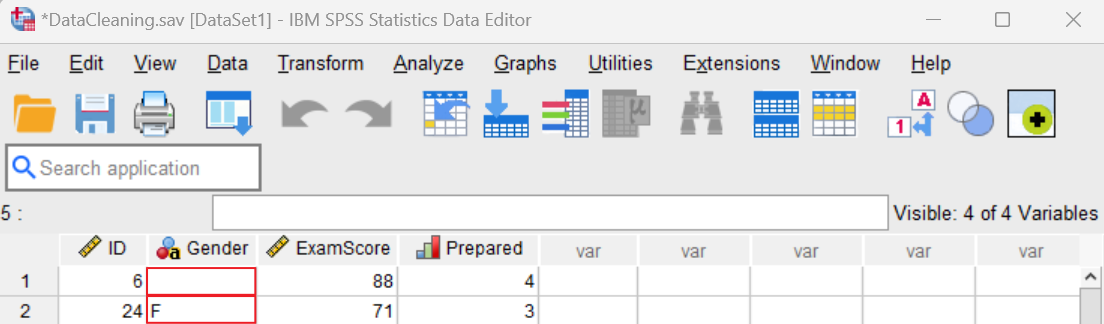
In the first row, the value for Gender is missing. We discuss missing values later in this tutorial.
We correct the “F” in the second row by double clicking on this cell and changing the value to “Female.”
Scrolling down, we find the other structural error. Again, we double click on the cell containing “male” and change it to “Male.”

Once you have corrected your structural errors, you should run another check to ensure that none remain.
Out of Range Values
There may be some data points in your data set that are obviously incorrect because they fall outside of the range of values that is possible for that variable. For example, if the maximum possible value for “Exam Score” is 100, then a score of 172 is clearly an error.
Identifying Out of Range Values in SPSS
To identify out of range values in SPSS, click Analyze -> Descriptive Statistics -> Frequencies. This brings up the Frequencies dialog box. Click Reset to clear any previous settings.
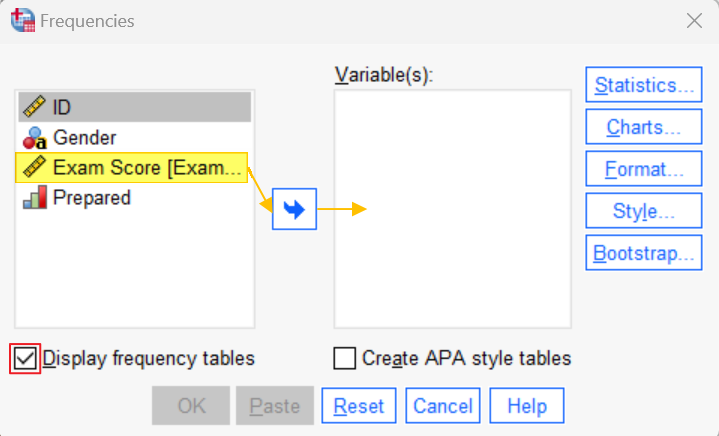
Next, select the first continuous variable in your data set (Exam Score in our example). Then, holding down the CTRL key on your keyboard, select any other continuous variables, and use the arrow button to move them to the Variable(s) box.
We recommend that you uncheck the Display frequency tables box, since we do not need these to check for out of range values. Your Frequencies dialog box should now look something like this:
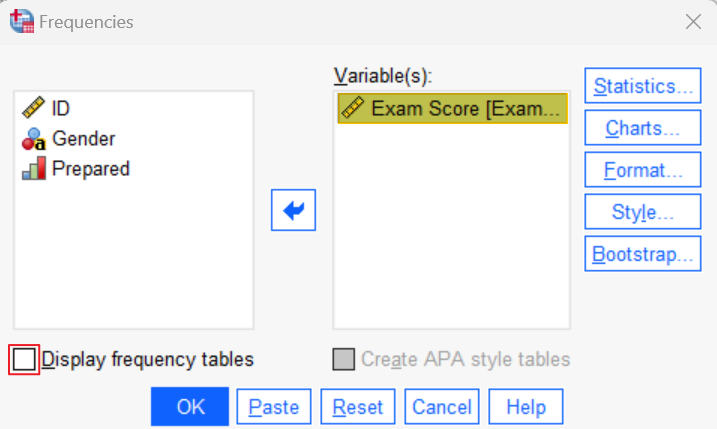
Click the Statistics button. This brings up the Frequencies: Statistics dialog box. Check the Minimum and Maximum boxes as illustrated below:
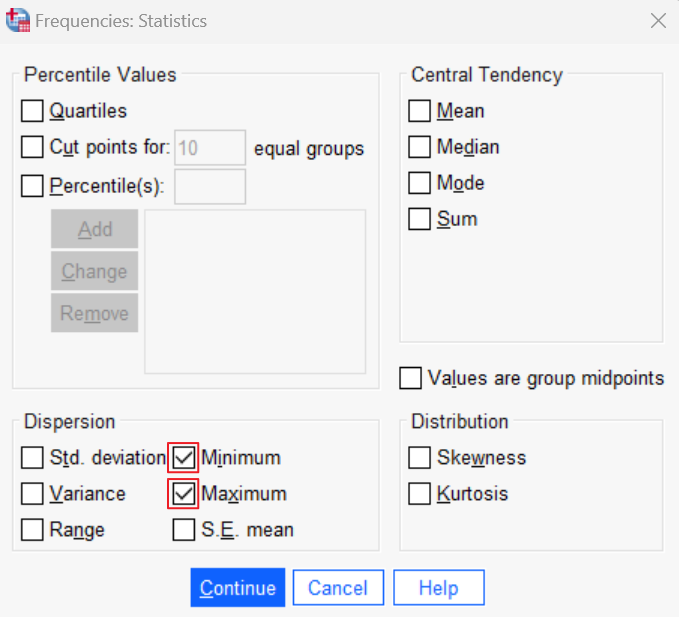
Click Continue to return to the main Frequencies dialog box, and then click OK.
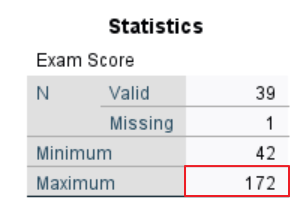
The SPSS Output Viewer will pop up with a Statistics table for the variables you selected.
Review the Minimum and Maximum for each of your selected variables to determine whether they make sense for these variables.
For “Exam Score,” the minimum value of 42 (out of 100) makes sense, but the maximum value of 172 is out of range. There is also a missing value for this variable. Missing values are discussed below.
Correcting Out of Range Values in SPSS
To correct out of range values for a variable, in the SPSS Data Viewer, right-click on the name of that variable (e.g., Exam Score) and select Sort Ascending or Sort Descending as applicable. Since we found a value that was higher than the possible range of values, we selected Sort Descending to have the highest value appear first.
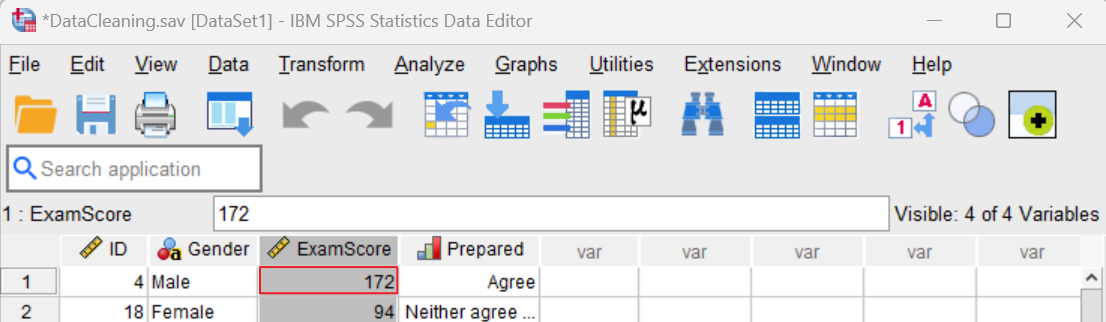
We only have one out of range value (172), but you may have many of these values in your data set.
There are two ways in which you can manage out of range values. If you are able to determine the correct value by checking the original record, then correct your data set accordingly.
If this is not possible, delete the out of range value by selecting the relevant cell in your data set and clicking the del (delete) button on your keyboard. It will then be treated as a missing value. Options for handling missing values are discussed below.
Once you have addressed your out of range values, run the check again to ensure that none remain.
Handling Outliers
Outliers are data points that are a long way away from the other data points in your data set. Unlike out of range values, outliers aren’t necessarily errors. Even when they aren’t errors, however, outliers can cause problems for some statistical tests.
Identifying Outliers
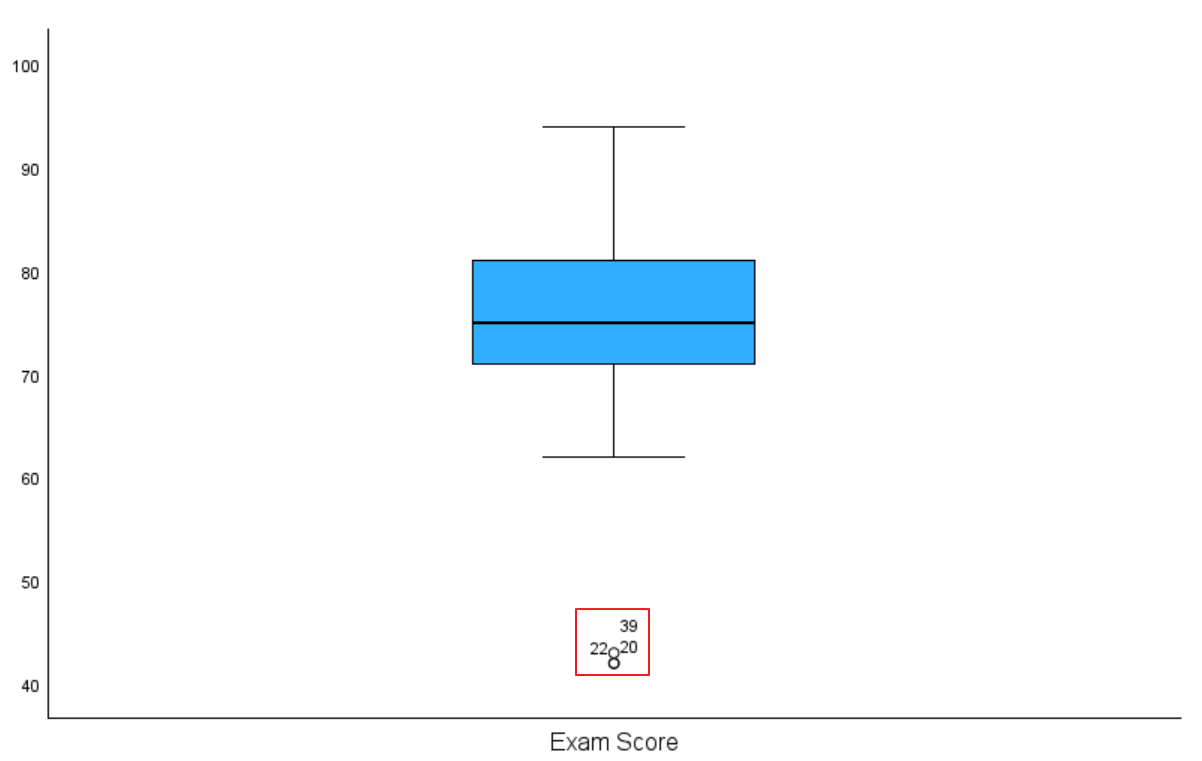
The first step is to identify the outliers in your data set. You can do this by creating boxplots for your continuous variables. Our boxplot for “Exam Score” identifies three outliers – case numbers 20, 22, and 39.
There are several techniques that you can use to address the outliers in your data set including correcting, removing, keeping, and replacing them.
Correcting Outliers
If possible, check the original record to determine whether the outlier is an error. If it is, and you can determine the correct value, correct your data set.
Removing Outliers
If the outlier is an error, but you cannot determine the correct value, you can delete it from your data set by selecting the relevant cell and clicking the del (delete) button on your keyboard. You should not delete legitimate observations.
Keeping Outliers
If your outliers are legitimate observations, you can keep them in your data set unchanged. However, the presence of outliers violates the assumptions of some statistical tests, so you may need to use a non-parametric test to analyze your data.
Replacing Outliers
Another approach is to replace outliers with values that are more consistent with the other values in your data set. One way of doing this is to Winsorize your outliers by replacing them with the next highest/lowest values for that variable.
If we chose this option, we would replace the exam scores in cases 20, 22, and 39 with the lowest value that is not an outlier in the data set. First, we would sort our data set on the variable of interest (Exam Scores) by right-clicking on the variable label in the SPSS Data View and selecting Sort Ascending.
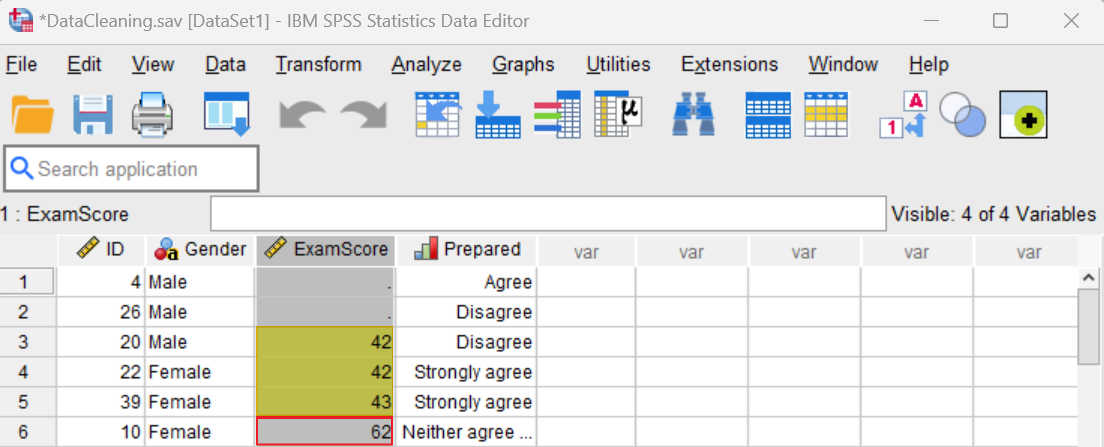
We can see that the lowest value that is not an outlier is 62, so we would replace the three lower values (42, 42, and 43) with 62.
If you remove or replace outliers that are not errors, you need to justify this decision when you write up the results of your study.
Missing Values
It is reasonably common for data sets to have missing values.
Identifying Missing Values in SPSS
To identify missing values, click Analyze -> Descriptive Statistics -> Frequencies. This brings up the Frequencies dialog box. Click Reset to clear any previous settings here.
Next, select your first variable (other than ID). Holding down the CTRL key on your keyboard, select the other variables, and use the arrow button to move them to the Variable(s) box. Your dialog box should now look something like this:
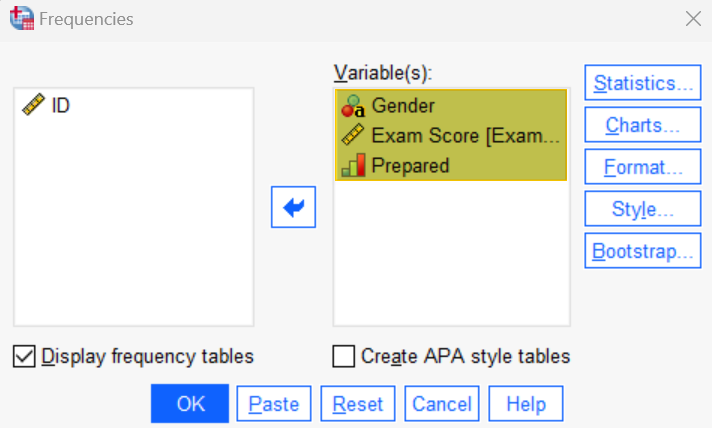
Click OK.
You will see a Statistics table and a frequency table for each of your selected variables in the SPSS Output Viewer.
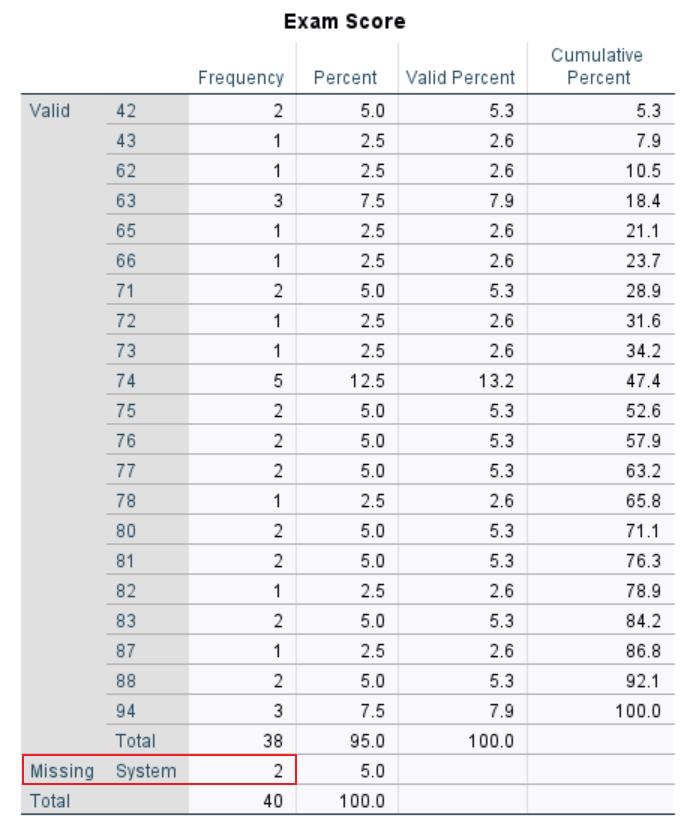
We see that there are two system missing values for “Exam Score.” System missing values are empty cells for numeric variables in a data set.
Important note: SPSS does not recognize empty cells for string variables as missing values in the Statistics table so you will need to check your frequency tables to identify these values.
“Gender” also has a missing value. Since “Gender” is a string variable, however, SPSS does not label it as missing. Rather, it is listed as a valid value without a label.
Managing Missing Values in SPSS
If you are able to determine the missing value by returning the original record, do so. If this is not possible, there are two main approaches to managing missing values in SPSS.
The first approach is to exclude missing values from your analyses. Listwise deletion means excluding cases that have any missing values. Pairwise deletion means excluding cases only if they are missing data for one of the variables that is needed to perform a particular calculation.
The second approach is to impute (or replace) your missing values with estimated values.
A discussion of how and when to implement these approaches is beyond the scope of this tutorial. We will dedicate a full tutorial to managing missing values in SPSS.
If you opt to replace your missing values, we recommend that you run another check for missing values in SPSS to ensure that none remain.
Once you have completed the data cleaning process, save your clean data set by clicking File -> Save As and using a different file name than the one you used for your original data set.
***************
That’s it for this tutorial. You should now be able to clean a data set in SPSS.
***************