In this tutorial we will show you how to perform and interpret the chi-square goodness of fit test in SPSS.
Quick Steps
- Click Analyze -> Nonparametric Tests -> Legacy Dialogs -> Chi-square
- Move your categorical variable to the Test Variable List box.
- Under Expected Values:
Ensure that the All categories equal option is checked OR
Check the Values option and enter your expected values. - Click OK.
What is the Chi-Square Goodness of Fit Test?
Researchers use the chi-square goodness of fit test to determine whether or not the distribution of cases or participants for a particular categorical variable (e.g., stated voting intentions) differs from a hypothesized distribution. There are two main types of hypotheses:
Equal Proportions Hypotheses
We can test whether cases are distributed equally across the groups of a categorical variable. For example, are the proportions of readers who prefer to read physical books, e-books and audio books equal?
Unequal Proportions Hypotheses
Alternatively, we can test whether the distribution of cases for our variable follows a set of unequal proportions that are known to exist in another population. For example, is the distribution of stated voting intentions for first-time voters the same as that of the general population?
For both types of hypotheses, we use the chi-square goodness of fit test to compare the observed distribution of cases for our variable to the expected distribution of cases based on our hypothesis.
Assumptions of the Chi-Square Goodness of Fit Test
Before you carry out a chi-square goodness of fit test, you should ensure that your data meets the assumptions of the test:
- You have a single categorical variable with two or more groups. For example, the variable “favorite book format” might include the groups physical books, e-books and audio books.
- The groups in your category are mutually exclusive. For example, a physical book cannot also be an e-book or an audiobook.
- The expected frequency of each group is 5 or more.
- Independence of observations.
Example
In this tutorial, we will test whether the distribution of stated voting intentions for first-time voters is the same as the distribution of stated voting intentions for the general population of a made-up country.
We know that the stated voting intentions of the general population are as follows:
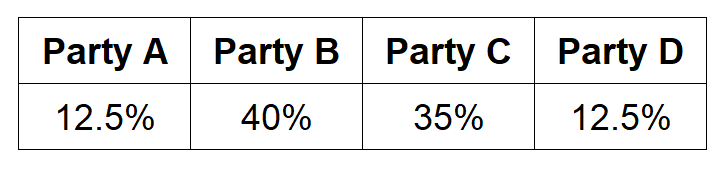
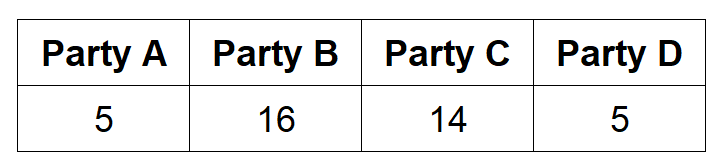
Our null hypothesis is that the distribution of stated voting intentions for first-time voters will be the same as it is for the general population – so we have an unequal proportions hypothesis. Thus, in our sample of 40 fictitious first-time voters, we expect that 5 voters (12.5%) will vote for Party A, 16 voters (40%) will vote for Party B, and so on, as illustrated below.
The chi-square test will tell us whether the stated voting intentions of first-time voters are indeed the same as those of the general population
The Data
There are two different ways in which you can structure your data to perform a chi-square goodness of fit test in SPSS. You can work with (a) data in a frequency table or (b) raw data. If your data is in a frequency table, you will need to weight your cases in SPSS before you perform your test. This step is described below.
Regardless of the way your data is structured, it is important to code your variable of interest (e.g., stated voting intention) numerically in SPSS. Please see our tutorial on defining variables in SPSS if you need help with coding your variable in this way.
Frequency Table
If your data is structured as a frequency table you will have two columns as illustrated below.
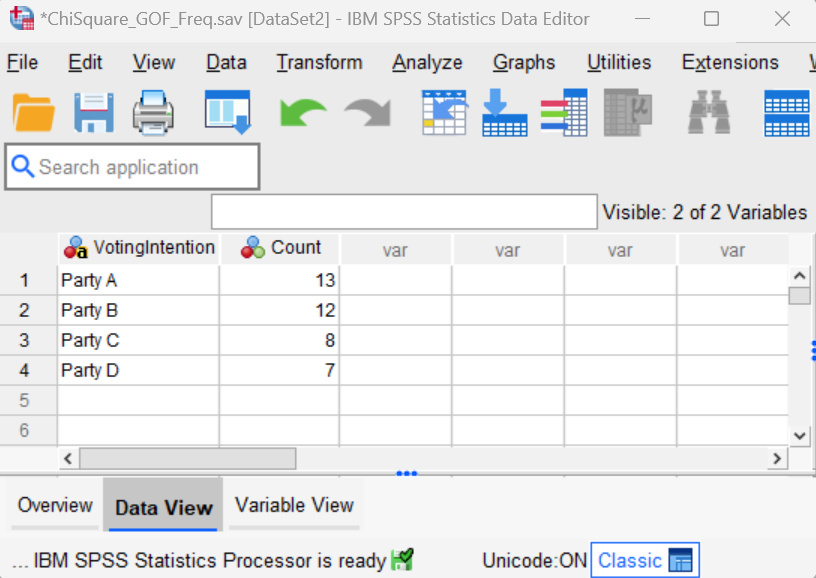
The first column contains the categorical variable (e.g., stated voting intention), and each case or row represents a group of that variable (e.g., Party A).
The second column contains the observed frequencies for that group. We see that 13 participants expressed the intention to vote for Party A, for example.
Important note: If your data is structured as a frequency table, you will need to weight your cases as outlined below before you perform a chi-square test in SPSS.
How to Weight Cases in SPSS
Click Data -> Weight Cases. This brings up the Weight Cases dialog box illustrated below.
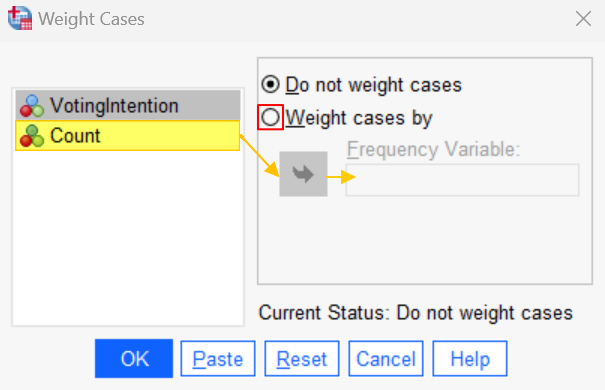
Select Weight cases by. Then select the weighting variable (e.g., “Count”), and use the arrow button to move it to the Frequency Variable box. Click OK. You will then see the phrase Weight On in the bottom right corner of your data set.
From now on, any analyses that you perform on this file will be carried out with weighted cases until you switch off this option in SPSS.
Once you weight your cases, you are ready to perform the chi-square goodness of fit test in SPSS.
Raw Data
Performing the chi-square goodness of fit test in SPSS is slightly easier when your file contains raw data as per the screenshot below.
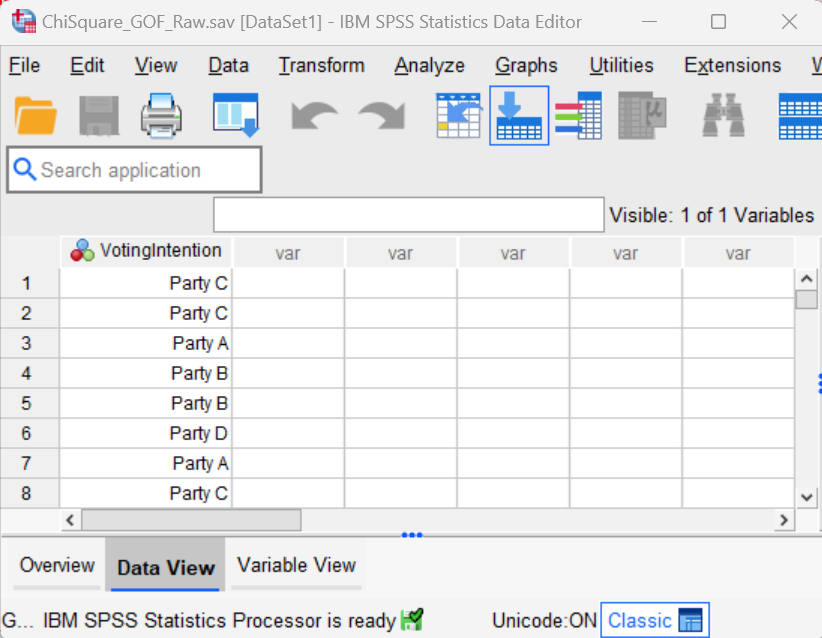
With this structure, you have just one column of data containing the observed values for your categorical variable. Each row represents the observed value for one case or participant. So, in our example, we can see that the first two participants expressed the intention to vote for Party C, the third participant expressed the intention to vote for Party A, and so on.
Do not weight cases if your data set contains raw data.
Chi-Square Goodness of Fit Test
To run your chi-square goodness of fit test, click Analyze -> Nonparametric Tests -> Legacy Dialogs -> Chi-square. This brings up the Chi-square Test dialog box below.
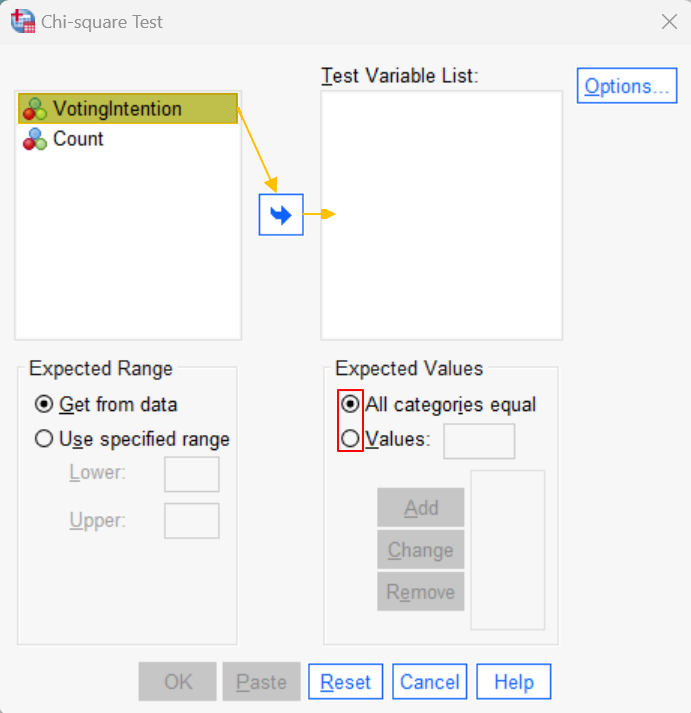
Select your categorical variable (VotingIntention in our example) and use the arrow button to move it to the Test Variable List box on the right.
Select the appropriate option under Expected Values as outlined below.
Equal Proportions Hypotheses
To test an equal proportions hypothesis, ensure that the All categories equal option is checked.
Unequal Proportions Hypotheses
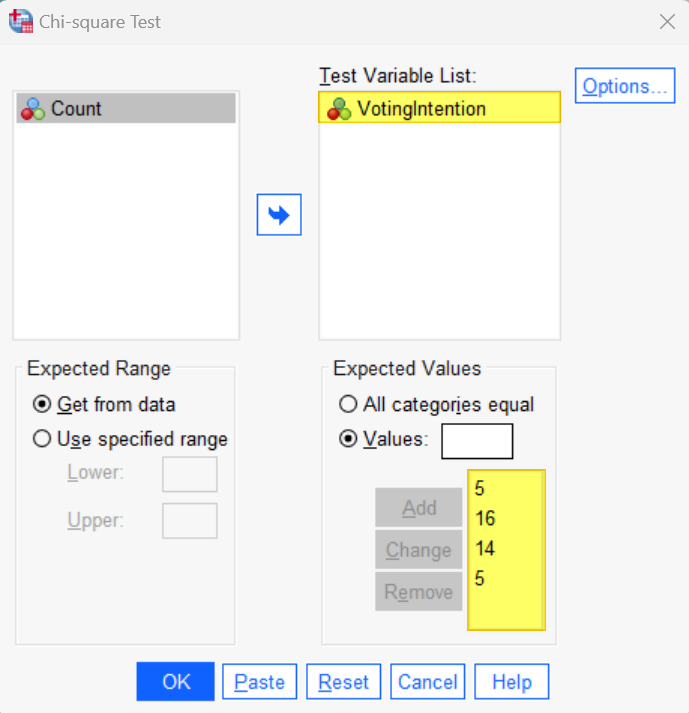
To test an unequal proportions hypothesis, check the Values option.
Then, in the Values box, enter the expected value for each group of the categorical variable. First, we need to enter the expected value for the category that has the lowest numeric coding in SPSS, then the expected value for the next lowest, and so on. It is important to enter these values in the correct order.
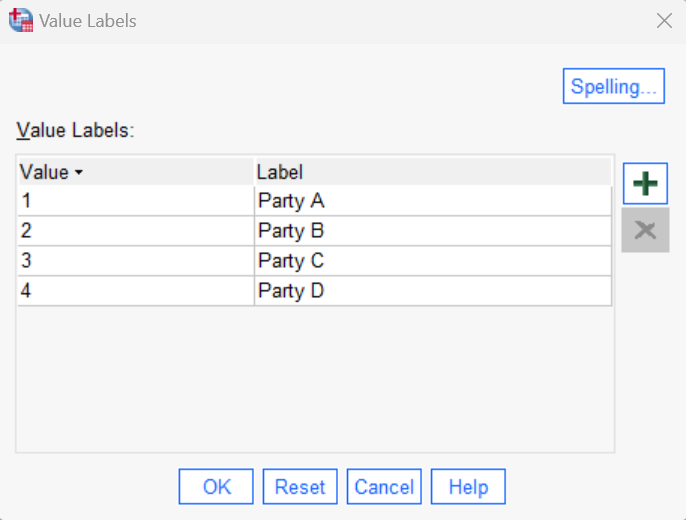
In our example, the category that is coded with the lowest numerical value (“1”) is Party A. We expect 5 participants to express the intention to vote for this party, so, 5 is the first value that we enter. Click Add.
Then, place your cursor in the Values box again and enter the expected value for each group of your category in ascending order of their numerical coding in SPSS. In our example, we enter the value for for Party B next because it’s numerical value is “2” in SPSS. We enter 16 because we expect 16 participants to state the intention of voting for this party. Click Add and repeat these steps until you have entered the expected values for each group.
This is how the populated Chi-square Test dialog box looks for our example:
Click OK. The SPSS Output Viewer will pop up with the results of your test.
Results and Interpretation
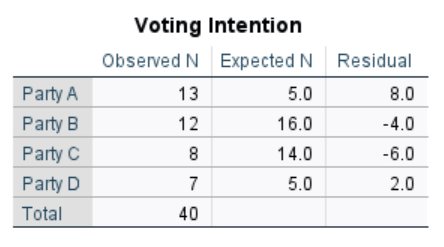
The first table we see gives us the observed and expected frequencies for each group of our categorical variable. The residual column tells us the difference between these two values.
Next, we review the Test Statistics table.
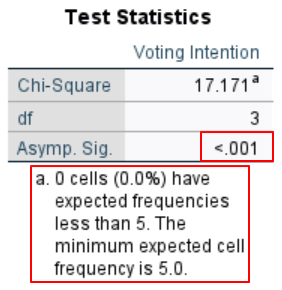
The Asymp. Sig. row of this table tells us whether our test was significant. Your test is significant if this value is less than or equal to the alpha value that you used for your study. Using the standard alpha value of .05 our value of < .001 is significant so we reject the null hypothesis. In other words, the distribution of stated voting intentions for first-time voters is significantly different from that of the general population.
This table also tells us that no cells have expected frequencies of less than 5. As noted earlier, an expected frequency of 5 or more for each group of your categorical variable is an assumption of the test.
Remove Case Weighting from Your File as Applicable
Note that, if you weighted your cases, any further analyses that you perform on this file will be carried out with case weighting unless you switch off this option. Note also that the case weighting will be saved with the file unless you remove it.
To remove case weighting, click Data -> Weight Cases. In the Weight Cases dialog box, click Reset and then click OK. The phrase Weight On should no longer appear in the bottom right corner of your data set.
***************
That’s it for this tutorial. You should now be able to conduct the chi-square goodness of fit test in SPSS, and interpret the results. You may also be interested in our tutorial on reporting the results of you chi-square goodness of fit test in APA style.
***************