In this tutorial we will show you how to report your chi-square goodness of fit test from SPSS in APA style.
First, we give you a template that you can use to report your results. Then, we show you how to populate this template using the SPSS output from your own test. Finally, we give you an example of a chi-square goodness of fit test results report written using our template
Please visit the APA Style website for more general information about formatting your reports in APA style.
Template for Reporting a Chi-Square Goodness of Fit Test in APA Style
Replace the [blue text in square brackets] in our template with information from your chi-square goodness of fit test. The (red numbers in parentheses) refer to the numbers on the screenshots of SPSS output and/or to our tips for writing your report (both are below). Feel free to modify the wording of our template as appropriate for your own test.
APA Template for Chi-Square Goodness of Fit Test
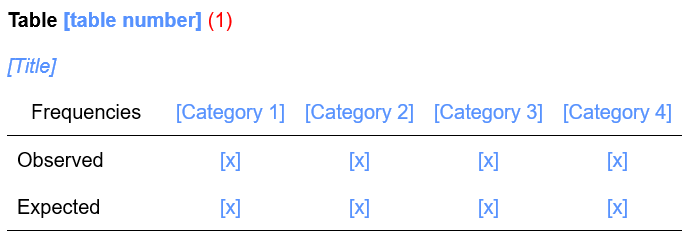
A chi-square goodness of fit test was performed to evaluate whether the distribution of [categorical variable] [hypothesized distribution of values for categorical variable]. The observed and expected frequencies for each [category] are presented in Table [table number] (1).
The distribution of [categorical variable] [was/was not] (2) significantly different from [hypothesized distribution of values for categorical variable], χ2 ([df] (3), N = [value of N] (4)) = [value of χ2] (5), p = [value of p] (6).
Populating the Chi-Square Goodness of Fit APA Template
The screenshots of SPSS output below are from a chi-square goodness of fit test that we carried out to evaluate whether the distribution of stated voting intentions for first-time voters was the same as that of the general population in a made-up country. The numbers on the screenshots reference those in our template. You will need to use the corresponding values from your own test.
As per the APA Style Guide: (a) the first line of each paragraph of your report should be indented 0.5 inches from the left margin; and (b) the text should be double-spaced.
(1) The yellow highlighted text, and the table it references, are optional. Tables in APA reports should be numbered. If this is the first table in your report, it is Table 1
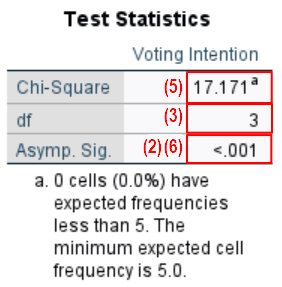
(2) Your chi-square goodness of fit test is significant if the p value in the Asymp. Sig. row of the Test Statistics table in the SPSS output is less than or equal to the alpha level you selected for your test. Selecting an alpha level of .05 is typical.
(3) Report the degrees of freedom (df) as per the Test Statistics table.
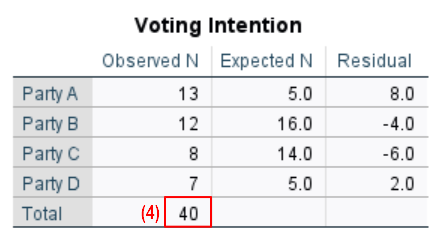
(4) N is the number of observations for your categorical variable. In our study, N = 40.
(5) Report χ2 to two decimal places as per the Chi-Square row of the Test Statistics table.
(6) Report the exact p value to two or three decimal places as per the Asymp. Sig. row of the Test Statistics table. However, if the p value is .000, report it as < .001. Do not add a leading zero to your p value.
Example of a Chi-Square Goodness of Fit Report in APA Style
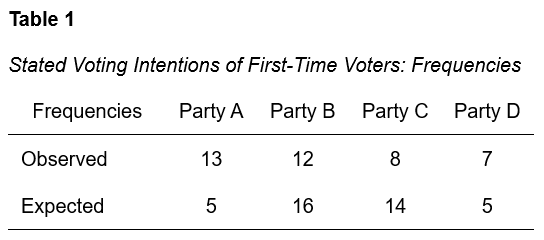
A chi-square goodness of fit test was performed to evaluate whether the distribution of [the stated voting intentions of first-time voters] [followed that of the general population]. The observed and expected frequencies for each [party] are presented in Table [1].
The distribution of [the stated voting intentions of first-time voters] [was] significantly different from [that of the general population], χ2 ([3], N = [40]) = [17.17], p = [< .001].
***************
That’s it for this tutorial. You should now be able to report the results of a chi-square goodness of fit test performed in SPSS in APA style.
***************