In this tutorial, we will show you how to conduct and interpret a Kruskal-Wallis test with post-hoc analysis in SPSS.
Researchers use the Kruskal-Wallis test to evaluate whether there are differences between three or more groups on a dependent variable measured at the continuous or ordinal level. For example, we could use it to evaluate whether there are differences between the Statistics exam scores of students enrolled in three different college majors.
The Kruskal-Wallis test is a non-parametric alternative to the one-way ANOVA. It is calculated using the ranks of scores, rather than the scores themselves.
Quick Steps
- Click Analyze -> Nonparametric tests -> Independent Samples…
- Select the Fields tab.
- Move the independent (or grouping) variable to the Groups box
- Move the dependent variable to the Test Fields box
- Select the Settings tab.
- Check the Customize tests option
- Check the Kruskal-Wallis 1-way ANOVA (k samples) option
- Click Run
Assumptions of the Kruskal-Wallis Test
The assumptions of the Kruskal-Wallis test are as follows:
- An independent categorical variable with three or more levels. Examples include martial status and race.
- A dependent variable measured at the ratio, interval or ordinal level. Examples include: height (ratio data), temperature (interval data), and level of education (ordinal data).
- Independence of observations. None of the observations (data points) in your data set is influenced by any of the other observations in your data set.
If your data meets the assumptions above, it can be analyzed using the Kruskal-Wallis test. Although it isn’t exactly an assumption, there is another important consideration to keep in mind:
- Does the distribution of scores on your dependent variable have a similar shape for each group or level of your independent variable?
-
- Yes: You can use the Kruskal-Wallis test to compare the medians of each group.
-
- No: You can only use the Kruskal-Wallis test to compare the mean ranks of each group.
If you follow the steps in this tutorial, SPSS will generate boxplots which you can use to determine whether the shape of your dependent variable is the same for each of your groups.
Example Research Question
We want to know whether the scores received by fictitious students on the same Statistics exam differ depending on whether those students are enrolled in the Biology, Chemistry, or Physics major. To answer this question, we will compare the exam scores for a random sample of 20 students from each major. Since our data does not meet all of the assumptions of the One-Way ANOVA, we will analyze our data with the Kruskal-Wallis test.
The Data
Our starting assumption for this tutorial is that you have already entered or imported your data into SPSS. Our data set contains the Statistics exam scores for the 60 fictitious students in our study.
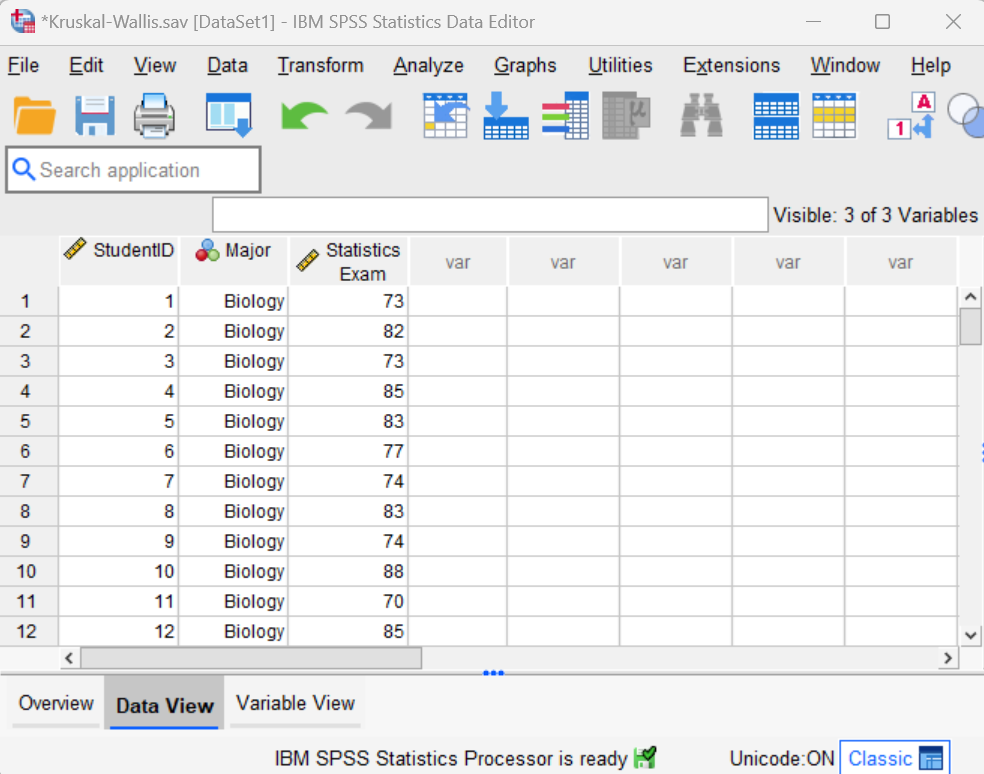
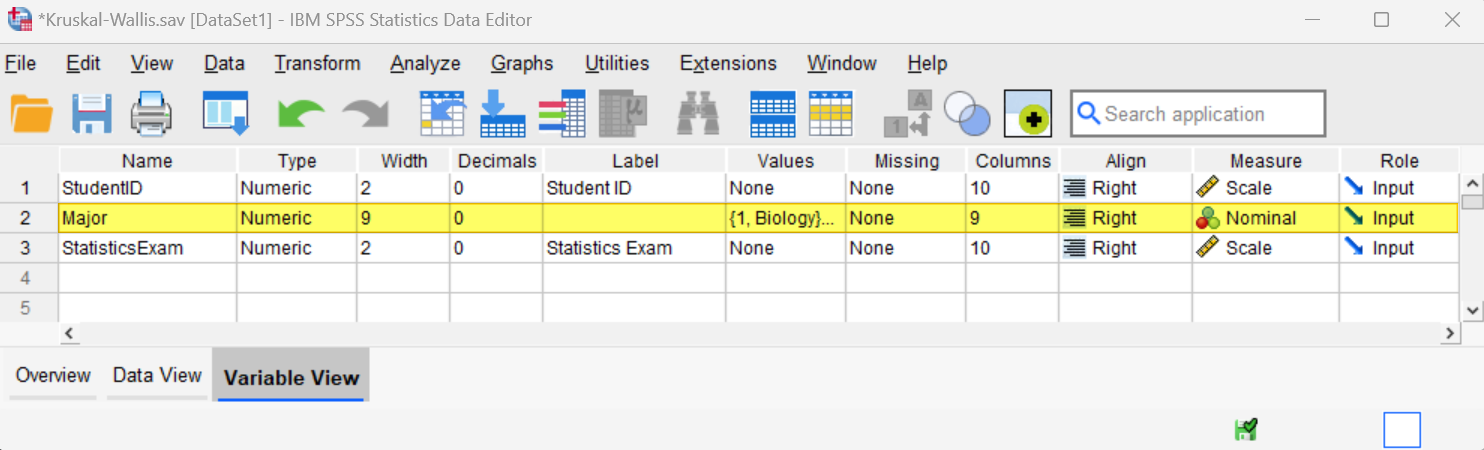
Note that it is important to code your independent variable (e.g., Major) as a numeric variable in SPSS as per the variable view of our data set below. Check out our tutorial on defining variables in SPSS for help with this step.
Kruskal-Wallis Test
To perform a Kruskal-Wallis test in SPSS, click Analyze -> Nonparametric tests -> Independent Samples… as illustrated below:
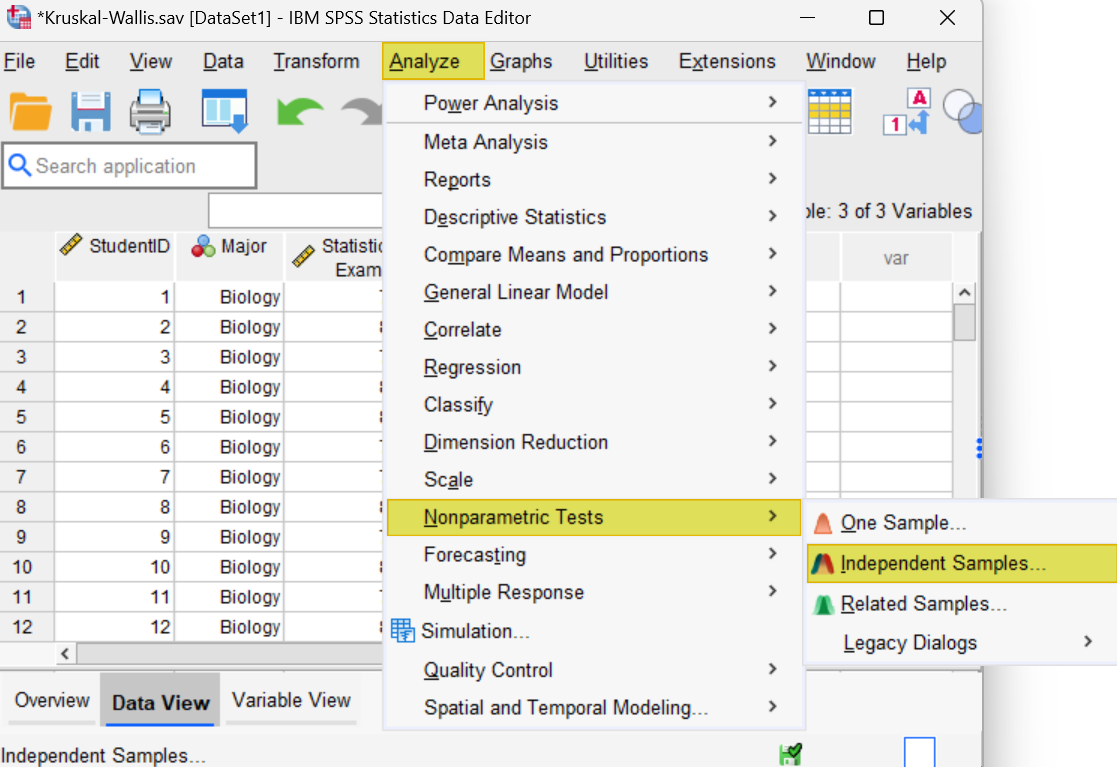
This brings up the Nonparametric Tests: Two or More Independent Samples dialog box. Select the Fields tab.
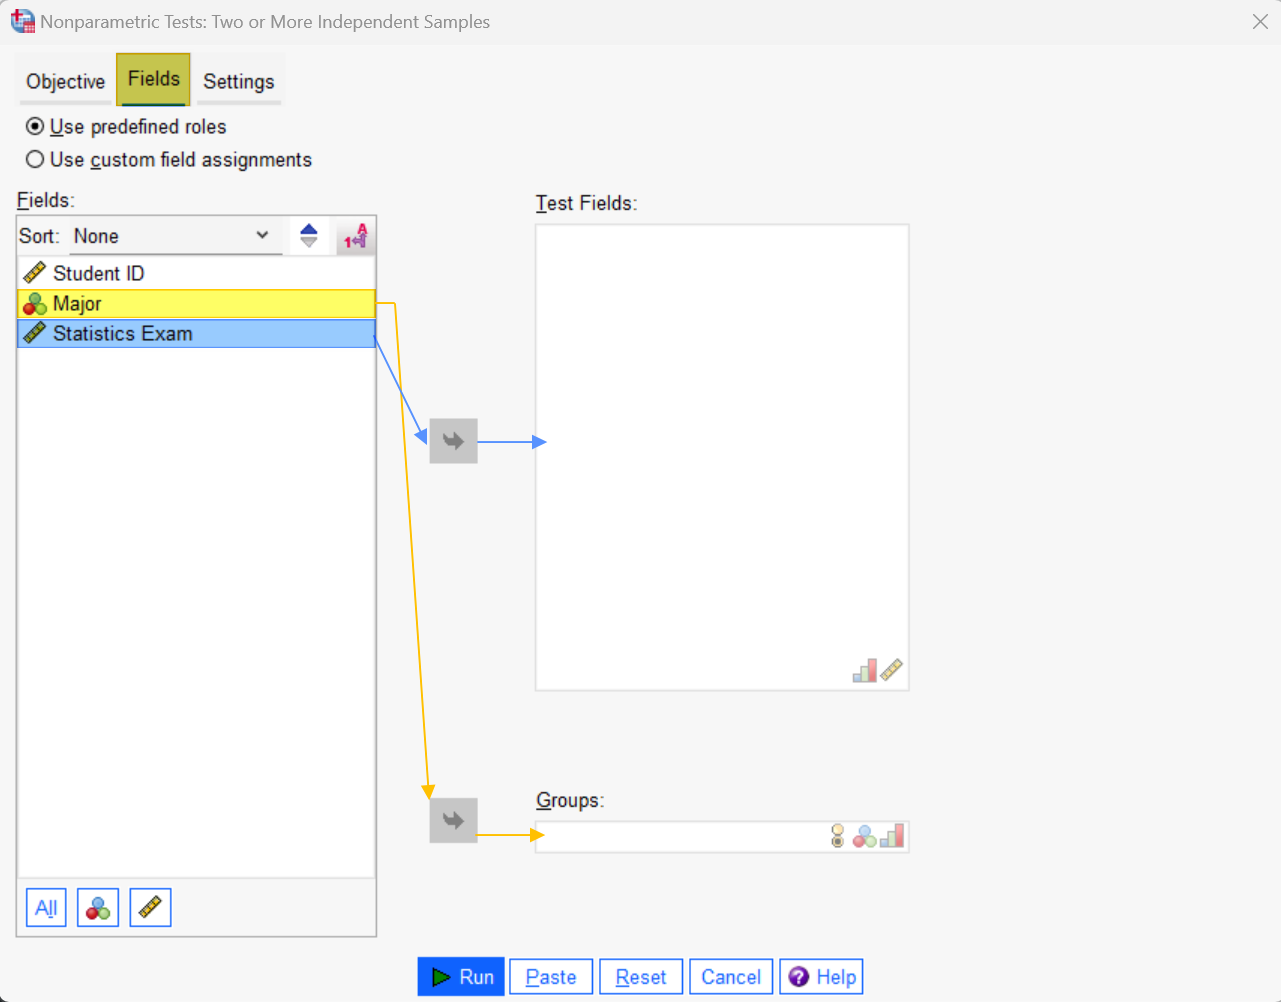
Select your independent (or grouping) variable (e.g., Major), and use the arrow button to move it to the Groups box. Then select your dependent variable (e.g., Statistics Exam), and use the arrow button to move it to the Test Fields box. The Fields tab of your dialog box should now look something like this:

Select the Settings tab of this dialog box.
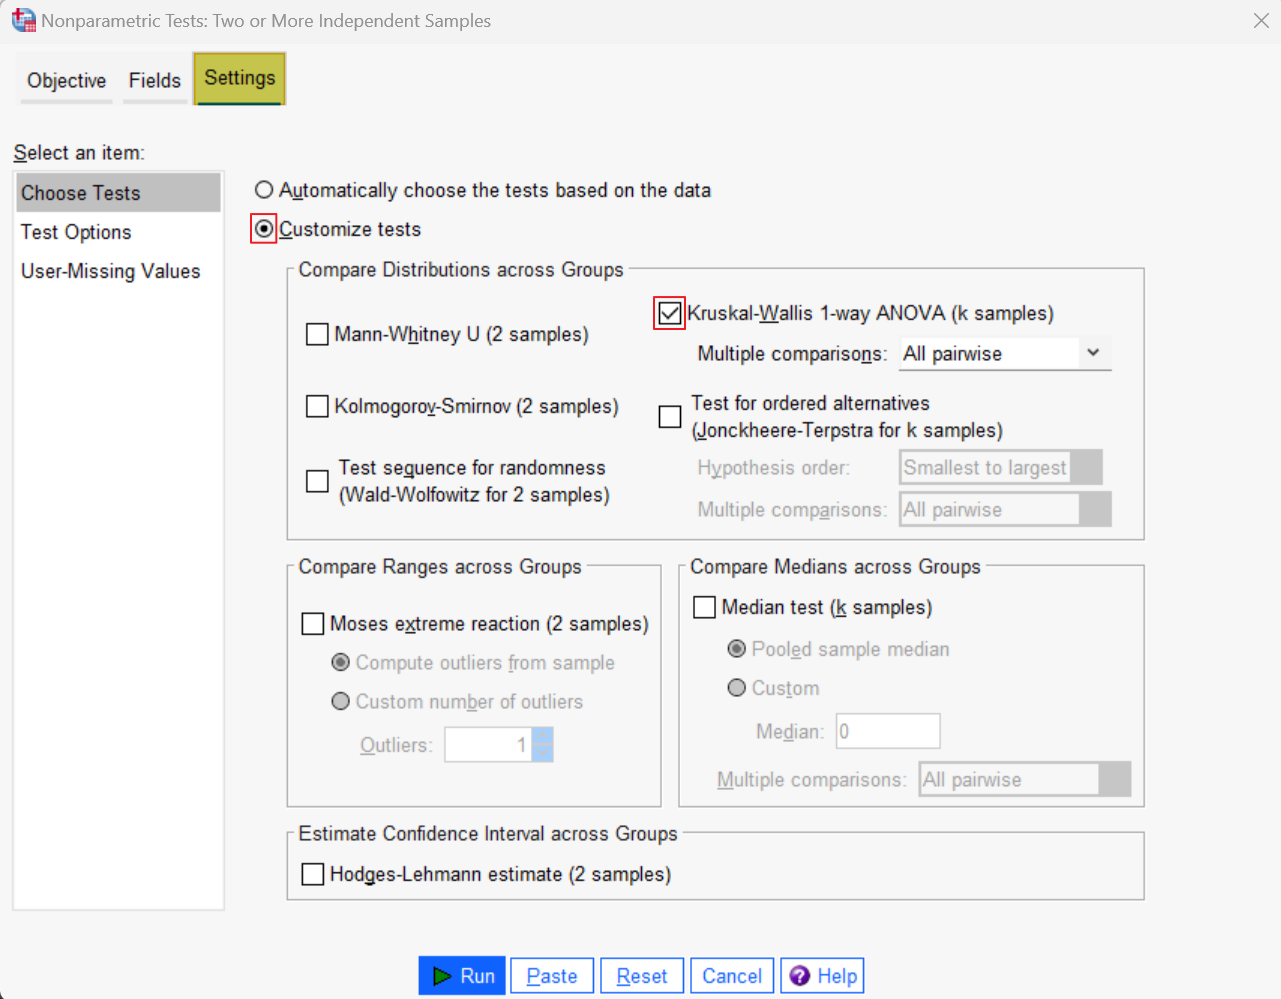
Check the Customize tests option. Then, under “Compare Distributions across Groups,” check the Kruskal-Wallis 1-way ANOVA (k samples) option.
Click Run. The SPSS Output Viewer will pop up with the results of your test.
Results and Interpretation
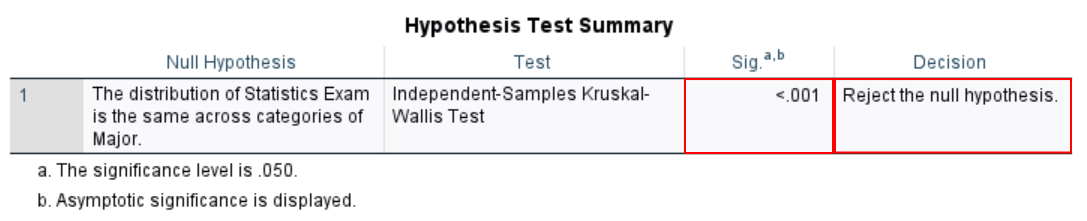
First we check the Decision column of the Hypothesis Test Summary table. In our example, the decision is to reject the null hypothesis because the Sig. value (p value) of <.001 here is less than the p value of .05 that we are using for our test. This indicates that there is a significant difference between students’ Statistics exam scores across majors.
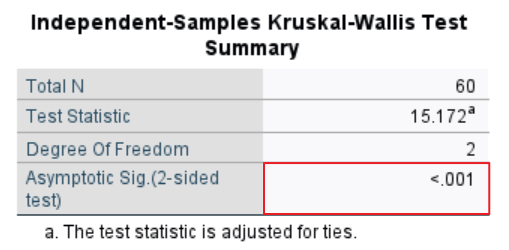
In the Asymptotic Sig. (2-sided test) row of the Independent-Samples Kruskal-Wallis Test Summary table, we see the same p value of <.001 together with some additional information that you will need when you write up the results of your study. We have a separate tutorial on reporting a Kruskal-Wallis test in APA style.
Post-Hoc Test Results
The two tables above indicate that there is a significant difference for the dependent variable (Statistics exam scores) across the independent variable (college major), but it does not tell us which groups of our independent variable are different from which other groups. To find out where the difference(s) lie, we need to check the post-hoc analysis in the Pairwise Comparisons table.
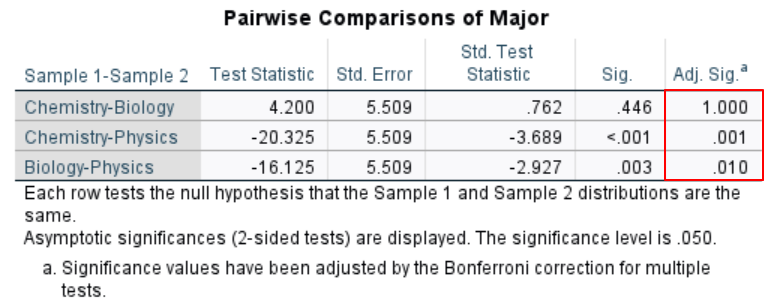
Using Dunn’s test, SPSS compares the dependent variable across each pairing of the independent variable to see where the significant difference(s) lie. The unadjusted Dunn’s test p values are in the Sig. column.
To reduce the risk of Type I errors (or false-positives), SPSS applies the Bonferroni correction to these values in the Adj. Sig. column. There is a significant difference between pairs of the independent variable if this value is less than or equal to the p value selected for the test. Using a .05 p value we see that:
- There is no significant difference between the Statistics exam scores of students in the Chemistry and Biology majors
- There is a significant difference between the scores of students in the Chemistry and Physics majors.
- There is also a significant difference between the scores of students in the Biology and Physics majors.
Distribution of Scores on the Dependent Variable
As noted earlier, if the distribution of scores on the dependent variable (Statistics exam scores) has a similar shape across each group of our independent variable (major), we can use the Kruskal-Wallis test to compare the medians of each group.
We can assess this distribution of scores by reviewing the boxplots in the SPSS output for our test.
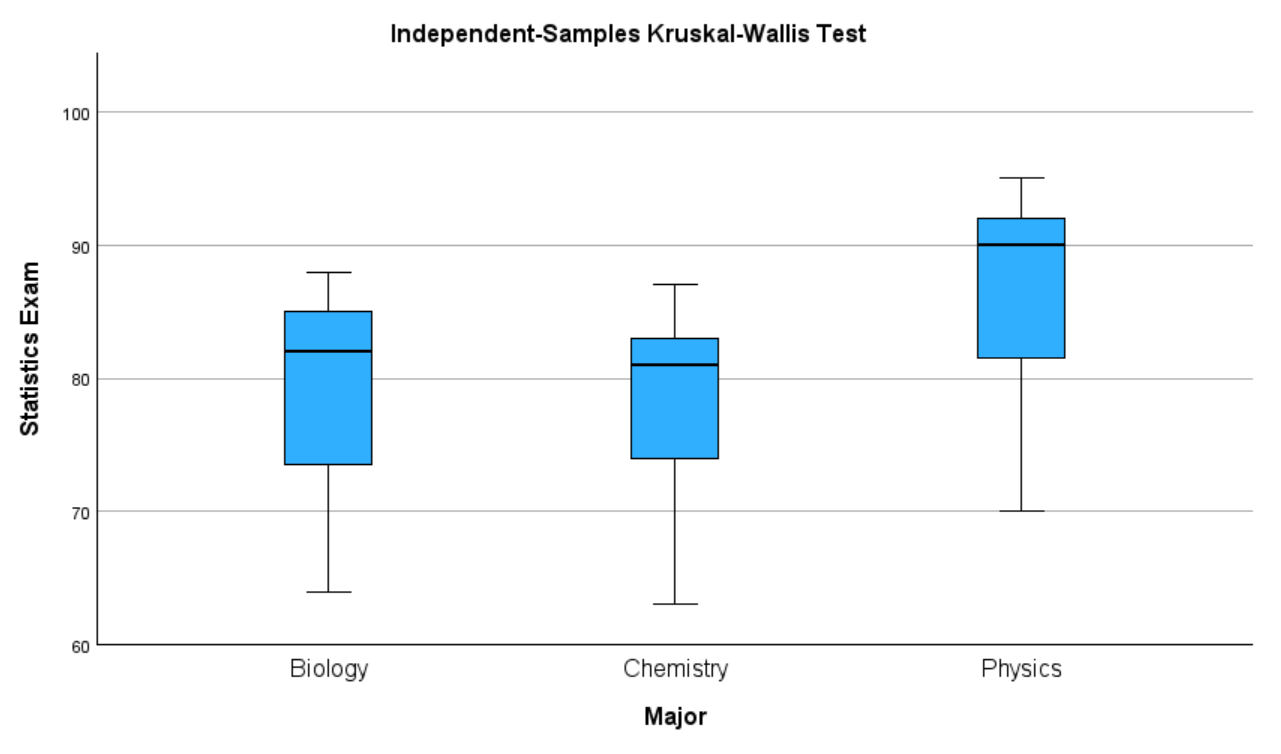
The boxplots for our fictitious study indicate that the distribution of Statistics exam scores has a roughly similar shape for each major. All the distributions are negatively skewed since the bottom whisker is longer than the top whisker and the median line is closer to the top of the box than to the bottom of it. This similarity means that we can use the Kruskal-Wallis test to compare the medians of each group.
Generating Group Medians in SPSS
SPSS does not include medians in the output for the Kruskal-Wallis test but we can generate them as follows. Click Analyze -> Compare Means and Proportions -> Means. This brings up the Means dialog box.
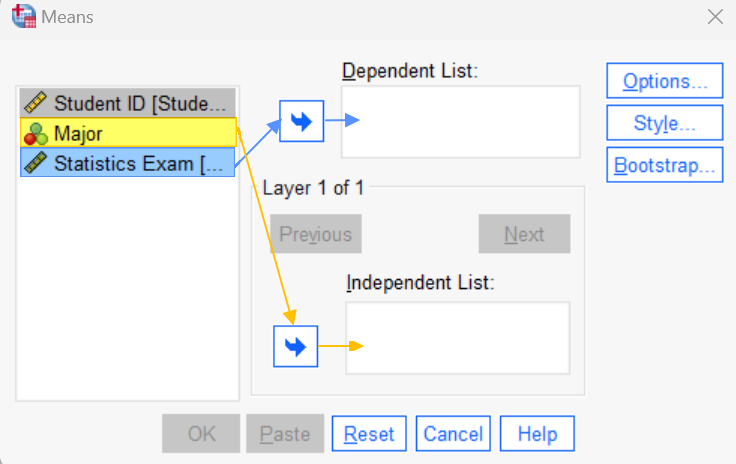
Move your independent (or grouping) variable (e.g., Major) to the Independent List box using the lower arrow button. Then, move your dependent variable (e.g., Statistics Exam) to the Dependent List box using the other arrow button.
Click Options.
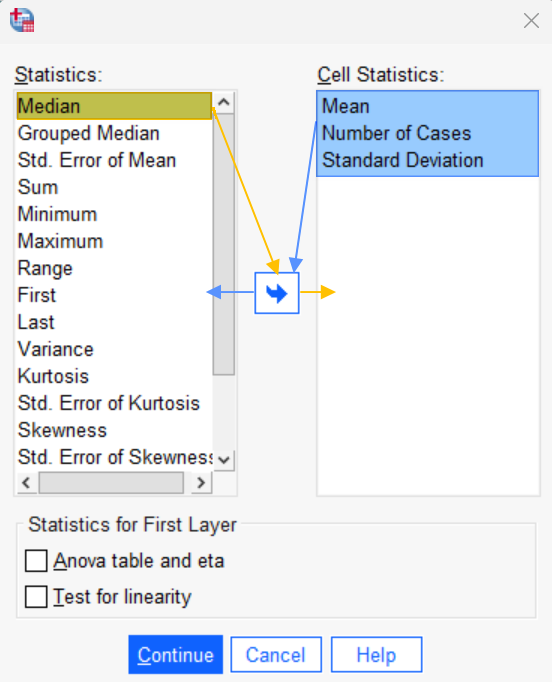
In the Statistics box, select Median and use the arrow button to move it to the Cell Statistics box on the right.
Then, in the Cell Statistics box, select Mean. Holding down the CTRL key on your keyboard, select Number of Cases and Standard Deviation. Use the arrow button to move them to the Statistics box on the left – we don’t need this information.
Click Continue then click OK to see these medians in the SPSS Output Viewer.
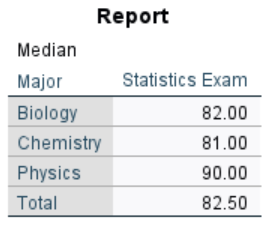
In our example, median Statistics exam scores were highest for students in the Physics major (90%), followed by Biology students (82%), then Chemistry students (81%).
Comparing the Mean Ranks of Your Groups
If the distribution of scores on your dependent variable does not have a similar shape for each level of your independent variable, you can only use the Kruskal-Wallis test to compare the mean ranks of each group. You will find these mean ranks in the Pairwise Comparisons chart in the SPSS output for your Kruskal-Wallis test.
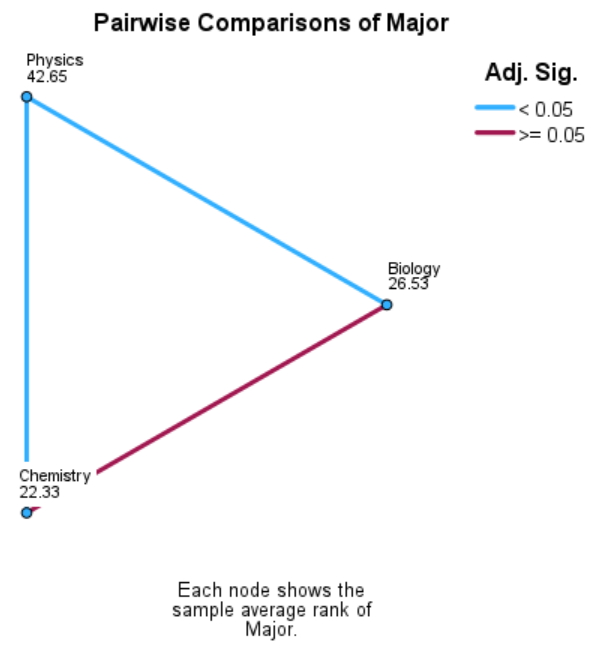
In our example, the mean ranks for students in the three majors are Physics (42.65), Biology (26.53) and Chemistry (22.33).
***************
That’s it for this tutorial. You should now be able to conduct and interpret a Kruskal-Wallis test with post-hoc analysis in SPSS. Please also check out our tutorial on reporting a Kruskal-Wallis test in APA style.
***************