In this tutorial we will show you how to report a Kruskal-Wallis test from SPSS in APA style.
First we give you a template that you can use to report the results of a Kruskal-Wallis test. Next we show you how to populate this template using the SPSS output from your own test. Finally we give you an example of a report written using our template.
We recommend consulting the APA Style website for more general information about writing reports in APA style.
Reporting a Kruskal-Wallis Test in APA Style
Replace the [blue text in square brackets] in our template with the relevant information from your own Kruskal-Wallis test. The (red numbers in parentheses) refer to the numbers on the screenshots of SPSS output and/or to our notes for writing your report (both are below). We encourage you to adapt the template as desired for your own study.
Template for Reporting a Kruskal-Wallis Test in APA Style
A Kruskal-Wallis test indicated that (1) there was no significant difference in [dependent variable] across [number of groups of independent variable (IV)] [IV], χ2 ([df] (2), N = [N] (3)) = [value of χ2] (4), p = [value of p] (5). OR there was a significant difference in [dependent variable] across [number of groups of IV] [IV], χ2 ([df] (2), N = [N] (3)) = [value of χ2] (4), p = [value of p] (5). The [median/mean rank] (6) [dependent variable] were [median/mean rank of IV group A] (7a) for [IV group A], [median/mean rank of IV group B] (7b) for [IV group B], and [median/mean rank of IV group C] (7c) for [IV group C] (8).
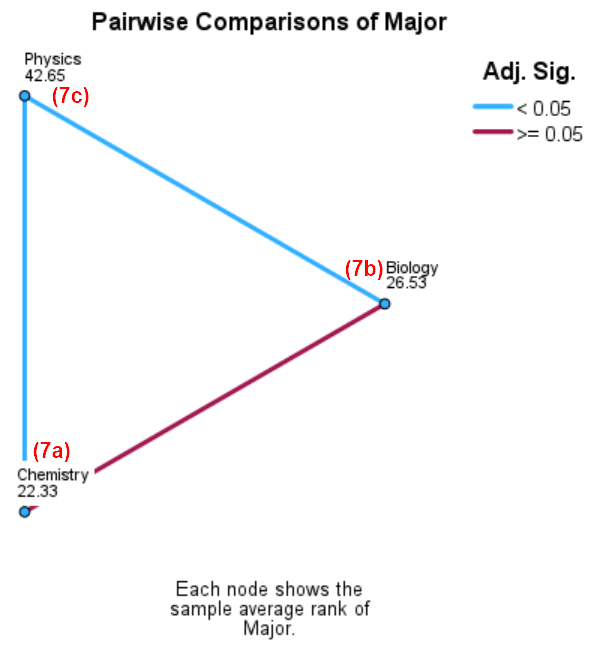
(9) Post-hoc comparisons using [method] (10) indicated that the [median/mean rank] (11) [dependent variable] of [IV group name] was significantly [higher/lower] (12) than that of [IV group name], p = [value of p] (13) (14). However, there was no significant difference between the [median/mean rank] (11) [dependent variable] of [IV group name] and [IV group name], p = [value of p] (13) (15).
Populating the Kruskal-Wallis Test APA Template
The screenshots of SPSS output below are from a Kruskal-Wallis test that we performed to evaluate whether the Statistics exam scores of fictitious students differed depending on whether they were enrolled in the Biology, Chemistry, or Physics major. The numbers on the screenshots refer to those in our template. Use the corresponding information from your own test to populate the template.
As per the APA Style Guide: (a) the first line of each paragraph of your report should be indented 0.5 inches from the left margin; and (b) the text should be double-spaced.
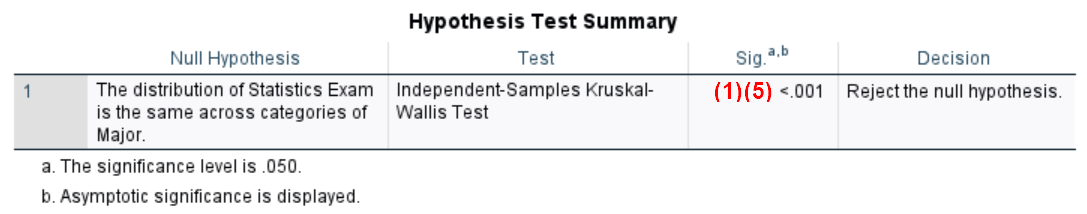
(1) Use the text highlighted in pink if there was no significant difference on the dependent variable (e.g., Statistics exam scores) across the groups in your study (e.g., college majors) Use the text highlighted in gold if there was a significant difference across groups. There is a significant difference if the p value in the Sig. column of the Hypothesis Test Summary table is less than or equal to the alpha level you selected for your test. Researchers often select an alpha level of .05.
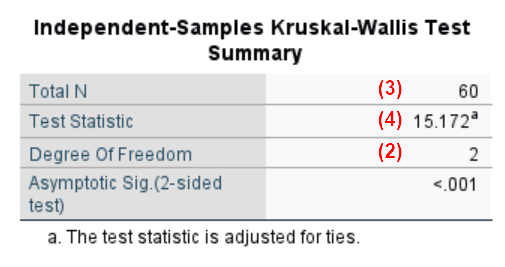
(2) Report the degrees of freedom (df) from the Independent-Samples Kruskal-Wallis Test Summary table.
(3) Report the number of cases/subjects as per the Total N row of the same table.
(4) Report the χ2 value as per the Test Statistic row of this table. Note that, in some previous versions of SPSS, this value will appear as the Kruskal-Wallis H instead of the Test Statistic.
(5) Report the exact p value to two or three decimal places as per the Sig. column of the Hypothesis Test Summary table (illustrated previously). However, if the p value is .000, report it as < .001. Do not add a leading zero.
Medians Vs. Mean Ranks for a Kruskal-Wallis Test?
(6) If the distribution of scores on the dependent variable (e.g., Statistics exam scores) has a similar shape across each group of the independent variable (e.g., college major), you can use the Kruskal-Wallis test to compare the medians of each group.
If the distribution of scores on the dependent variable does not have a similar shape across each group, use the Kruskal-Wallis test to compare the mean ranks of each group.
We can assess this distribution of scores by reviewing the boxplots for our test.
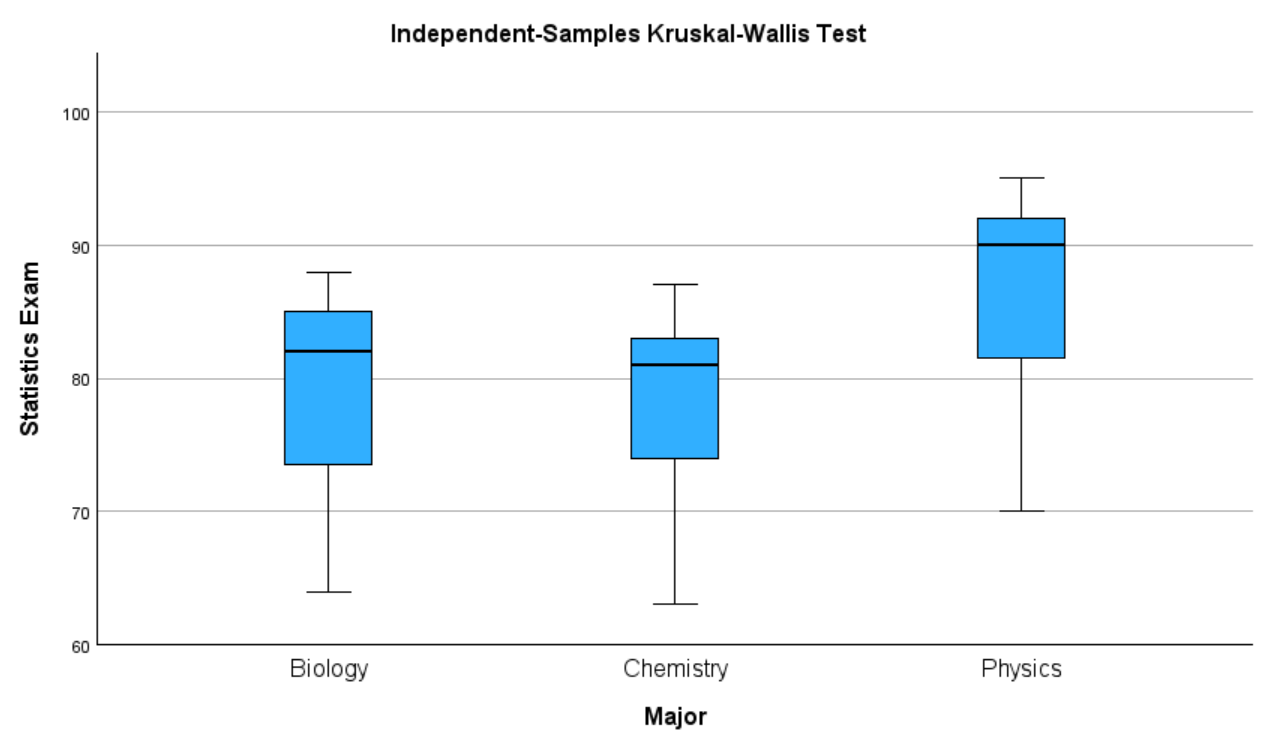
The boxplots for our fictitious study indicate that the distribution of the dependent variable is roughly similar for each group. We can therefore use the Kruskal-Wallis test to compare the medians of each group.
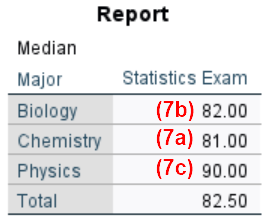
(7) SPSS does not automatically generate median scores for the Kruskal-Wallis test. We show you how to generate these in our Kruskal-Wallis tutorial. The medians for our example study are below:
SPSS automatically generates the mean ranks for each group in a Pairwise Comparisons chart like the one below:
(8) We have included a sentence for reporting the medians or mean ranks of the dependent variable for each group in the text of our template. If you have a large number of groups in your study, however, consider reporting your medians or means ranks in an APA style table instead.
Post-Hoc Comparisons
(9) We recommend reporting post-hoc comparisons from the Pairwise Comparisons table if your Kruskal-Wallis test is significant. The rationale for reporting these comparisons is that a significant Kruskal-Wallis test indicates only that there is a significant difference for the dependent variable (e.g., Statistics exam scores) across the groups of the independent variable (e.g., college major). It doesn’t tell tell us which groups are different from from which other groups.
You should not report post-hoc comparisons if your test is not significant.
(10) Specify the method used for post-hoc pairwise comparisons. The values in the Sig. column of the Pairwise Comparisons table (outlined in blue below) use Dunn’s method. The values in the Adj. Sig. column (outlined in red) use Dunn’s method with a Bonferroni correction for multiple tests. A discussion of when to use the Bonferroni correction is beyond the scope of this tutorial.
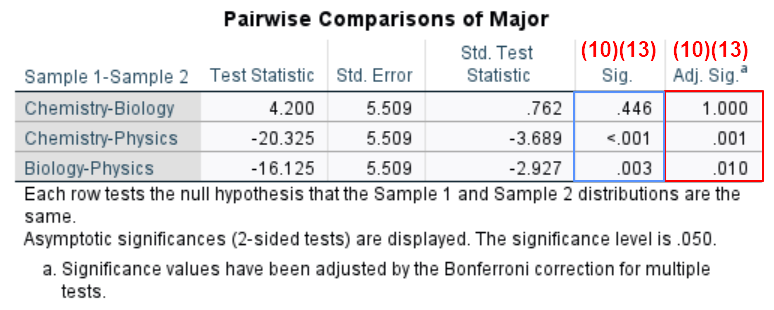
(11) As per (6) above, we compare the median scores of the dependent variable if the distribution of these scores has a similar shape for each group. We use mean ranks if the distribution of scores does not have a similar shape for each group.
(12) Use an appropriate adjective (e.g., higher, lower) to compare pairs with a significant difference. There is a significant difference if the p value in the applicable column of the Pairwise Comparisons table (Sig. or Adj. Sig.) is less than or equal to the alpha level selected for your test. Researchers often select an alpha level of .05.
(13) Report the p value for the pairwise comparison from the Sig. or Adj. Sig. column of the Pairwise Comparisons table as applicable.
(14) Report this information for each pairwise comparison with a significant difference.
(15) Report this information for each pairwise comparison for which there isn’t a significant difference.
Kruskal-Wallis Test: Example Report in APA Style
A Kruskal-Wallis test indicated that there was a significant difference in [students’ Statistics exam scores] across [three] [college majors], χ2 ([2], N = [60]) = [15.17], p = [< .001]. The [median] [Statistics exam scores] were [81%] for [Chemistry majors], [82%] for [Biology majors], and [90%] for [Physics majors].
Post-hoc comparisons using [Dunn’s method with a Bonferroni correction for multiple tests] indicated that the [median] [Statistics exam scores] of [students enrolled in the Physics major] was significantly [higher] than that of [students enrolled in the Chemistry major], p = [.001] and [students enrolled in the Biology major], p = [.010]. However, there was no significant difference between the [median] [Statistics exam scores] of [students enrolled in the Chemistry major] and [those enrolled in the Biology majors], p = [1.000].
**************
That’s it for this tutorial. You should now be able to report the results of a Kruskal-Wallis test from SPSS in APA style.
***************