In this tutorial we show you how to conduct simple main effects tests in SPSS for a two-way ANOVA with a significant interaction effect. We also show you how to interpret the results of these tests.
The two-way ANOVA (analysis of variance) assesses the effects of two independent categorical variables on a continuous dependent variable. If you find a significant interaction effect between your independent variables (for example, between gender and college major), this means that the effect of one variable depends on the level of the other variable. In this scenario, we do not interpret the main effects because they may be misleading. Rather, we conduct simple main effects tests.
Quick Steps
Note: steps 2.-4. below are redundant if you ran a two-way ANOVA for the same data set in your current SPSS session
- Click Analyze -> General Linear Model -> Univariate
- Select Reset (recommended)
- Move your dependent variable to the Dependent Variable box
- Move your two independent variables to the Fixed Factor(s) box
- Click EM Means
- Move the interaction to the Display means for box.
- Click Continue
- Click Paste
- Modify the statement in the Syntax Editor
- Click Run -> All
The Two-Way ANOVA Results
Our starting assumptions are that you have run a two-way ANOVA in SPSS and that you found a significant interaction effect between your independent variables (also known as factors).
Our fictitious data set contains Data Science exam scores for 60 students enrolled in one of three majors – Sociology, Political Science, and Economics. We wanted to find out whether these exam scores differ based on students’ gender and college major (our two independent variables). A two-way ANOVA found that there was a significant interaction effect between major and gender. We have decided to follow up by conducting simple main effects tests (also known as simple effects test).
The Simple Main Effects Test
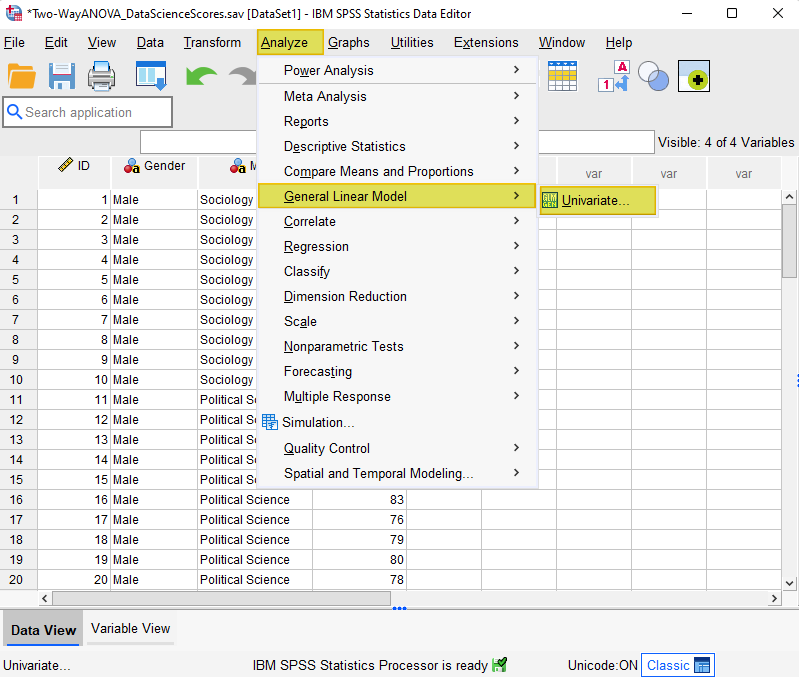
To conduct a simple main effects tests, click Analyze -> General Linear Model -> Univariate as per the screenshot below.
The Univariate dialog box will open.
If you ran a two-way ANOVA for the same data set in your current SPSS session, and you have not conducted analyses on other data sets since then, you should see something similar to the screenshot below. That is, the dependent variable will be in the Dependent Variable box and the two independent variables will be in the Fixed Factor(s) box.
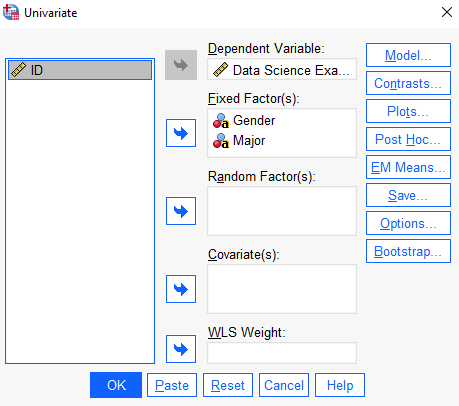
If you didn’t run a two-way ANOVA on the same data set in your current SPSS session, you can set this up as follows.
We recommend that you click the Reset button first to clear any previous settings.
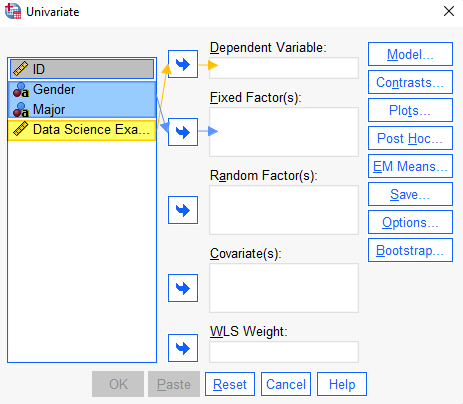
As per the screenshot below, select your dependent variable (Data Science exam score in this example) and use the arrow button to move it to the Dependent Variable box. Then select your two independent variables (gender and major in this example) and use the arrow button to move them to the Fixed Factor(s) box.
Click EM Means.
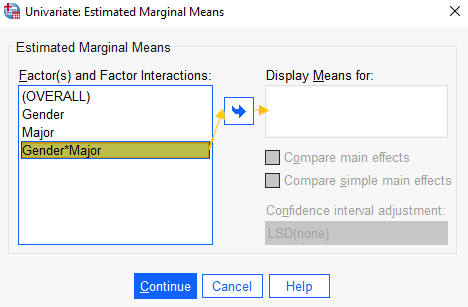
The Univariate: Estimated Marginal Means dialog box will open.
Select the interaction (Gender*Major in this example) and use the arrow button to move it from the Factor(s) and Factor Interactions box to the Display Means for box.
Click Continue. This takes you back to the Univariate dialog box.
Instead of clicking OK, click Paste
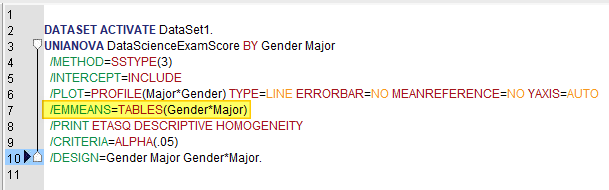
The SPSS Syntax Editor will open and you should see syntax similar to that illustrated below.
Select the highlighted statement that starts with /EMMEANS=TABLES and copy it. Note that the parentheses that follows this text will contain the interaction between your two independent variables (Gender*Major in our example).
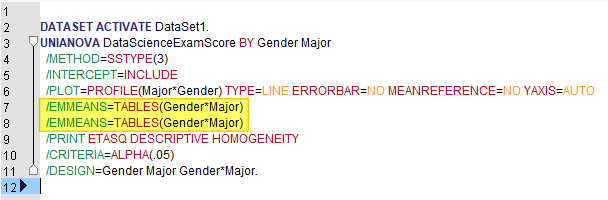
Deselect the statement you have just copied and select the return key on your keyboard to create a blank line under it. Paste the statement that you just copied to the line below so that it is duplicated as illustrated below.
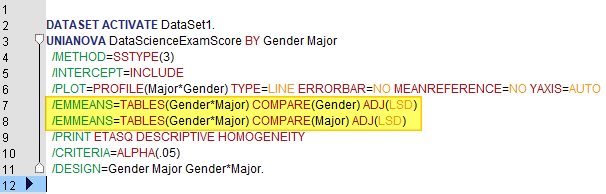
Type the following at the end of the first statement: COMPARE(Name of First Independent Variable) ADJ(LSD). For example if the name of your first independent variable is “Gender”, you would type COMPARE(Gender) ADJ(LSD).
Repeat this step for the second statement but this time the parentheses will include the name of your second independent variable. You should now see something like the syntax below. The edited statements are highlighted in yellow.
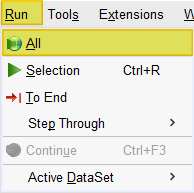
Click Run -> All to run the commands in the SPSS Syntax Editor.
The SPSS Output Viewer will pop up with the results of your two-way ANOVA and your simple main effects tests. Note that if you ran the main two-way ANOVA in the current SPSS session, and you didn’t deselect your selections in the “Options” and “Plots” dialog boxes (we didn’t), SPSS will reproduce the descriptive statistics, estimates of effect size, Levene’s test and profile plot in the Output Viewer.
Results and Interpretation of the Simple Main Effects Test
As per the steps above, we ran both possible main effects, namely:
- The simple main effects of major within gender, and
- The simple main effects of gender within major
To keep this tutorial simple, we will focus on the main effects of gender within major. You will need to decide which simple main effects is most relevant for your own data.
Simple Main Effects
The simple main effects of gender within major are presented in the Univariate Tests table below
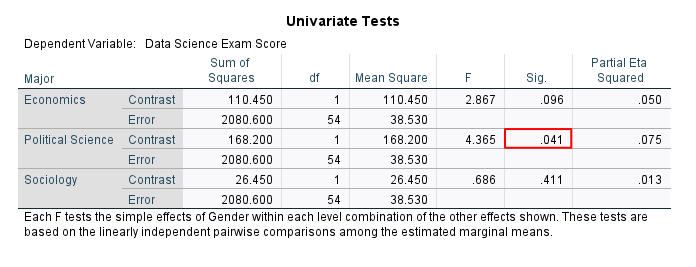
We can see that the p-value (in the “Sig.” column) for the Political Science major is less than .05. This means that there is a significant difference between the mean Data Science exam scores of male and female students who are enrolled in this major. In contrast, the p-values for the Economics and Sociology majors are greater than .05. This means that the differences between the mean Data Science exam scores of male and female students is not significant in either of these majors.
Pairwise Comparisons
The Pairwise Comparisons table displays the mean differences between the Data Science exam scores for male and female students in each major. Note that SPSS uses an asterisk to denote significant differences in the dependent variable (the Data Science exam score).
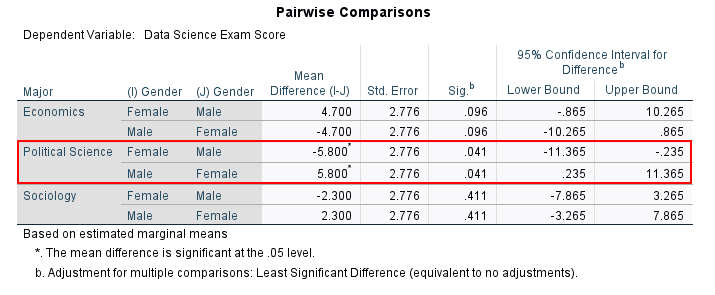
Again, this table shows that there is a significant difference between the mean Data Science exam scores of male and female students in the Political Science major only . In other words, our data indicates that the effect of gender on students’ Data Science exam scores depends on their major.
***************
That’s it for this tutorial. You should now be able to conduct simple main effects tests in SPSS for a two-way ANOVA with a significant interaction effect. You may also be interested in our tutorials on: (1) reporting the results of a two-way ANOVA in APA style and (2) exporting SPSS output to another application such as Word, Excel, or PDF.