In this tutorial we show you how to report a two-way ANOVA (analysis of variance) from SPSS in APA style.
First, we provide a template that you can use to report your two-way ANOVA in APA style. We show you how to populate it using your SPSS output, and we give you an example report written with our template.
Next, we provide two optional templates that you can use to report follow up tests for your two-way ANOVA. One is is for simple main effects tests following a significant interaction between your independent variables. The other is for pairwise comparisons when there is no significant interaction but one or more of the main effects is significant.
For additional information about formatting your reports in APA style, please refer to the APA Style website.
Template for Reporting a Two-Way ANOVA in APA Style
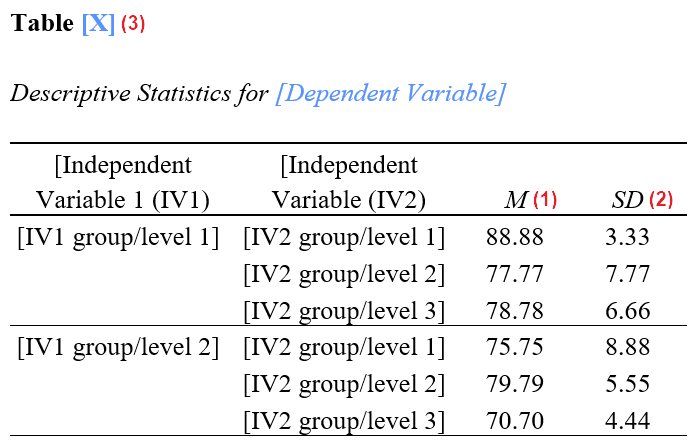
Replace the [blue text in square brackets] in our template with information from your two-way ANOVA. The (red numbers in parentheses) correspond to numbers on the screenshots of SPSS output below and/or our notes and tips for writing your report (also below).
APA Template Text: Two-Way ANOVA
A two-way ANOVA was performed to evaluate the effects of [independent variable 1] and [independent variable 2] on [dependent variable]. The means (1) and standard deviations (2) for [dependent variable] are presented in Table [table number] (3) below.
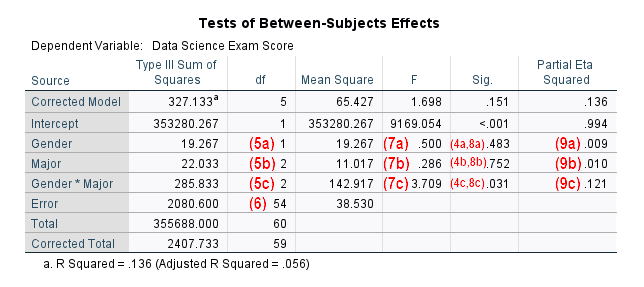
The results indicated [a significant/no significant] (4a) main effect for [independent variable 1], F([independent variable1 df] (5a), [error df] (6)) = [F value] (7a), p = [p value] (8a), partial η2 = [partial η2] (9a); [a significant/no significant] (4b) main effect for [independent variable 2], F([independent variable 2 df] (5b), [error df] (6)) = [F value] (7b), p = [p value] (8b), partial η2 = [partial η2] (9b); and [a significant/no significant] (4c) interaction between [independent variable 1] and [independent variable 2], F([interaction df] (5c), [error df] (6)) = [F value] (7c), p = [p value] (8c), partial η2 = [partial η2] (9c).
Populating the Two-Way ANOVA APA Template With SPSS Output
The numbers in the screenshots below correspond to numbers in the APA reporting template above. Use these values from your SPSS output to populate our template.
Selected SPSS Output
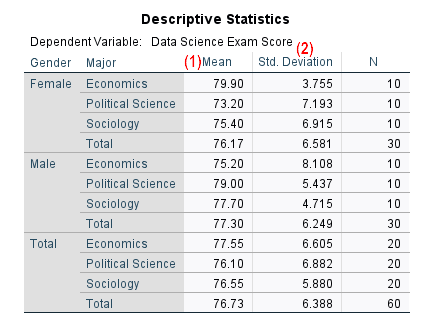
The SPSS output below is from a two-way ANOVA performed on a fictitious data set to determine whether students’ Data Science exam scores differ based on gender and college major.
Notes and Tips for Writing Your Report in APA Style
The APA Style Guide states that: (a) the first line of each paragraph should be indented 0.5 inches from the left margin; and (b) the text should be double-spaced.
(1) Report means to two decimal places.
(2) Report standard deviations to two decimal places.
(3) Tables in APA reports should be numbered. If this is the first table in your report, it will be Table 1. Note that our example table is for a 2 x 3 two-way ANOVA. That is, the first independent variable has two groups or levels, and the second independent variable has three groups or levels.
(4) The following are significant if the p value in the “Sig.” column of the Tests of Between-Subjects table for that variable or interaction is less than or equal to the alpha level you selected for your ANOVA. An alpha level of .05 is typical.
- (4a) The main effect for independent variable 1
- (4b) The main effect for independent variable 2
- (4c) The interaction effect between these two independent variables
Two-Way ANOVAs may result in any combination of significant and non-significant effects for the three effects above.
(7) Report the F values from the Tests of Between-Subjects Effects table to two decimal places for the independent variables (7a and 7b), and the interaction between them (7c). If an F value is less than 1.00, add a leading zero.
(8) Report the exact p values for the main effects (8a and 8b) and the interaction effect (8c) to two or three decimal places as per the SPSS output. However, if a p value is .000, report it as < .001. You should not add leading zeros to p values.
(9) Round the partial η2 values to two decimal places for the main effects (9a and 9b), and the interaction effect (9c). You should not add leading zeros to these values. If you have a partial η2 of less than .005, we suggest reporting this as < .01 rather than rounding it down to .00
We encourage you to tweak the wording of the template as needed for your own ANOVA.
Example of a Two-Way ANOVA Report in APA Style
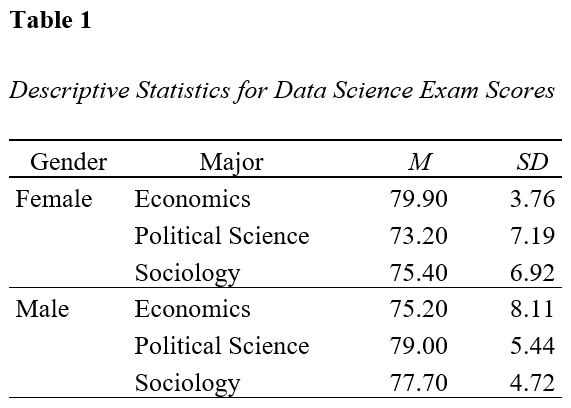
A two-way ANOVA was performed to evaluate the effects of [gender] and [college major] on [students’ Data Science exam scores]. The means and standard deviations for [students’ Data Science exam scores] are presented in Table [1] below.
The results indicated [no significant] main effect for [gender], F([1], [54]) = [0.50], p = [.483], partial η2 = [.01]; [no significant] main effect for [major], F([2], [54]) = [0.29], p = [.752], partial η2 = [.01]; and [a significant] interaction between [gender] and [major], F([2], [54]) = [3.71], p = [.031], partial η2 = [.12].
Reporting Two-Way ANOVA Follow Up Tests (Optional)
It is quite common to conduct follow up tests for two-way ANOVAs in the following scenarios:
(1) If you found a significant interaction effect between your independent variables, you may have conducted simple main effects tests.
(2) If there was no significant interaction effect but one or more of your main effects was significant, you may have performed pairwise comparisons.
You can report the results of these follow up test using the APA style templates below.
Simple Main Effects Tests for a Two-Way ANOVA
If you found a significant interaction effect between your independent variables and you followed up with simple main effects tests, you can use the following template after the template for the two-way ANOVA.
Simple Main Effects Tests Template
Simple main effects tests indicated that [dependent variable] were significantly (10) [higher/lower] (11) for [level A of independent variable X] than for [level B of independent variable X] in [level A of independent variable Y] (p = [p value]) (12) (13). There was no significant difference (10) between [dependent variable] of [level A of independent variable X] and [level B of independent variable X] in [level B of independent variable Y] (p = [p value]) (12) (14).
Populating the Simple Main Effects APA Template With SPSS Output
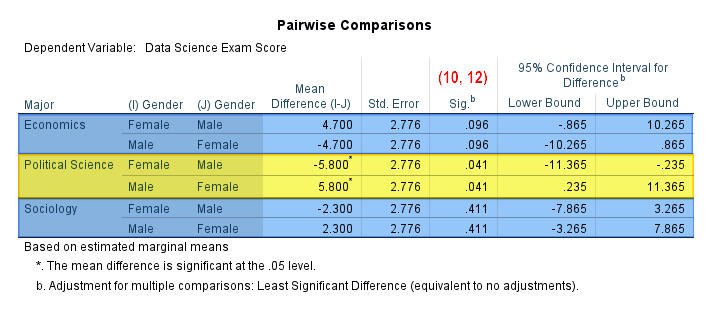
(10) There is a significant difference between the dependent variable for “levels” of independent variable X within a level of independent variable Y (e.g., between the male and female students in the Political Science major) if the p value in the “Sig.” column of the Pairwise Comparisons table for that level of independent variable Y is less than or equal to the alpha level you selected for your test. SPSS adds an asterisk in the Mean Differences column for differences that are significant at an alpha level of .05. In our screenshot, there is a significant difference between the Data Science exam scores of male and female students in the Political Science major (highlighted yellow). There is no significant difference between the Data Science exam scores of male and female students in the Economics or Sociology majors (highlighted blue).
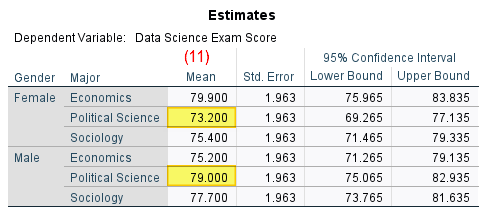
(11) The easiest way to determine whether the dependent variable (Data Science exam scores in our example) for one level of independent variable X is higher or lower than another level of that variable within a particular level of independent variable Y is by comparing the values in the “Mean” column of the Estimates table. In our example, male Political Science students have a higher mean Data Science exam score (79.20%) than their female counterparts (73.20%).
(12) Report the exact p values for each pairwise comparison to two or three decimal places as per the Pairwise Comparisons table in the SPSS output (illustrated above). If a p value is .000, report it as < .001. You should not add leading zeros to your p values.
(13) Report this information for each pairwise comparison for which there was a significant difference in the dependent variable.
(14) Report this information for each pairwise comparison for which there was no significant difference in the dependent variable.
Example APA Report: Simple Main Effects Tests for a Two-Way ANOVA
Simple main effects tests indicated that [Data Science exam scores] were significantly [higher] for [male students] than for [female students] in [the Political Science major] (p = [.041]). However, there were no significant differences between [the Data Science exam scores] of [male] and [female students] in either [the Economics major] (p = [.096]) or the [Sociology major] (p = [.411]).
Pairwise Comparisons for a Two-Way ANOVA
You can use the following template (after the template for the two-way ANOVA) if you found a significant main effect for one or both of your independent variables, the variable(s) had at least three levels, and you followed up with pairwise comparisons.
Pairwise Comparisons Template
Post hoc testing using [follow up test name] (15) indicated that [dependent variable] were significantly (16) [higher/lower] (17) for [level A of independent variable] than they were for [level B of independent variable] (p = [p value]) (18) (19). There was no significant difference (16) between the [dependent variable] of [level B of independent variable] and [level C of independent variable] (p = [p value]) (18) (20).
Populating the Pairwise Comparisons APA Template with SPSS Output
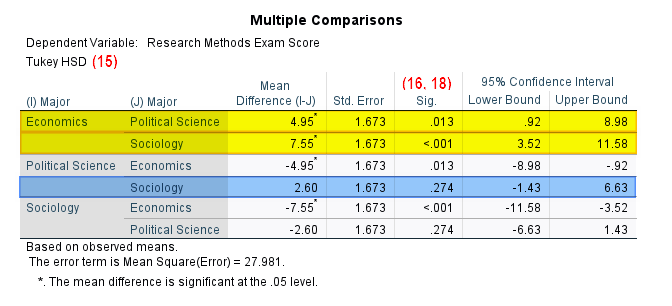
(15) Enter Tukey’s HSD or the name of an alternative test that you used to conduct pairwise comparisons.
(16) There is a significant difference between the dependent variable (Research Methods exam scores in our example) for different levels of an independent variable if the p value in the “Sig.” column of the Multiple Comparisons table for that pairwise comparison is less than or equal to the alpha level that you selected for your test. SPSS adds an asterisk to the “Mean Difference (I-J)” column for differences that are significant at an alpha level of .05. In the screenshot below, there is a significant difference between the Research Methods exam scores of students in the Economics and Political Science majors. There is also a significant difference between the exam scores of students in the Economics and Sociology majors (both highlighted yellow). There is no significant difference between the Research Methods exam scores of students in the Political Science and Sociology majors (highlighted blue).
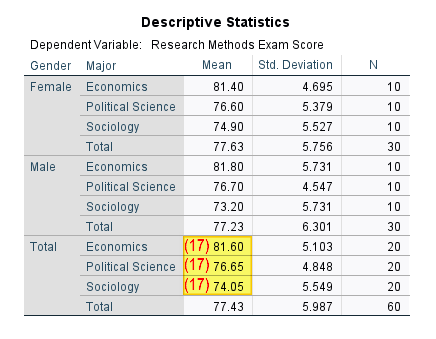
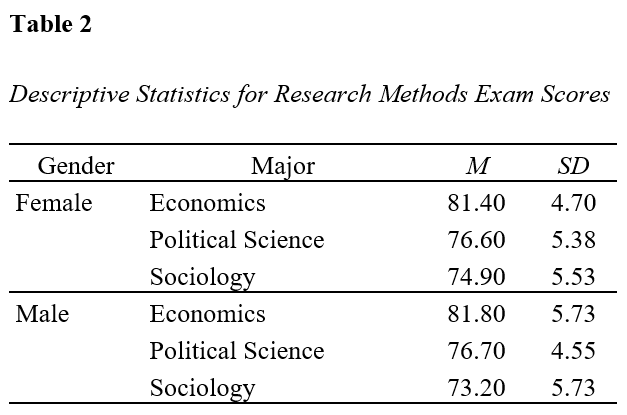
(17) The easiest way to determine whether the dependent variable (Research Methods exam scores in our example) for one level of an independent variable is higher or lower than another level of that independent variable is by referring to the “Mean” column in the Descriptive Statistics table. In our example, students in the Economics major have higher mean exam scores (81.60%) than students in both the Political Science (76.65%) and Sociology majors (74.05%).
(18) Report the exact p values for each pairwise comparison to two or three decimal places as per the Multiple Comparisons table in the SPSS output (illustrated above). If a p value is .000, report it as < .001. You should not add leading zeros to your p values.
(19) Report this information for each pairwise comparison for which there was a significant difference in the dependent variable.
(20) Report this information for each pairwise comparison for which there was no significant difference in the dependent variable.
Example APA Report: Pairwise Comparisons for a Two-Way ANOVA
The example report below includes the results of both the two-way ANOVA and the pairwise comparisons conducted after the ANOVA:
A two-way ANOVA was performed to evaluate the effects of [gender] and [college major] on [students’ Research Methods exam scores]. The means and standard deviations for [students’ Research Methods exam scores] are presented in Table [2] below.
The results indicated [no significant] main effect for [gender], F([1], [54]) = [0.09], p = [.771], partial η2 = [< .01]; [a significant] main effect for [major], F([2], [54]) = [10.52], p = [< .001], partial η2 = [.28]; and [no significant] interaction between [gender] and [major], F([2], [54]) = [0.23], p = [.795], partial η2 = [.01].
Post hoc testing using [Tukey’s HSD] indicated that [the Research Methods exam scores] were significantly [higher] for [students in the Economics major] than they were for students in both [the Political Science major] (p = [.013]) and [the Sociology major] (p =[< .001]). However, there was no significant difference between the [the Research Methods exam scores] of [students in the Political Science major] and [students in the Sociology major] (p = [.274]).
***************
That’s it for this tutorial. You should now be able to report the results of two-way ANOVAs and follow up tests from SPSS in APA style.
***************