The two-way ANOVA (analysis of variance) assesses the effects of two independent categorical variables on a continuous dependent variable. If you find a significant main effect for one or both of your independent variables with a two-way ANOVA – and you do not find a significant interaction effect between these variables – you can conduct pairwise comparisons to determine which levels of your independent variable(s) are significantly different from the other levels. In this tutorial we show you how to perform and interpret these pairwise comparisons in SPSS.
This tutorial assumes that you conducted your two-way ANOVA on a study with: (1) a separate sample for each treatment condition or population; and (2) an equal number of participants (or cases) in each group.
Quick Steps
Note: You will not need to take steps 2.-4. if you ran a two-way ANOVA for the same data set in your current SPSS session
- Click Analyze -> General Linear Model -> Univariate
- Click Reset (recommended)
- Move your dependent variable to the Dependent Variable box
- Move your two independent variables to the Fixed Factor(s) box
- Click Post Hoc
- Move independent variable(s) that have more than two levels, and for which there is a significant main effect, to the Post Hoc Tests for box.
- Check the box for Tukey (and/or other post-hoc tests as desired).
- Click Continue
- Click OK
The Two-Way ANOVA Results
The starting assumptions for this tutorial are that you:
- have run a two-way ANOVA in SPSS
- did not find a significant interaction effect between your independent variables, and
- did find a significant main effect for one or both of your independent variables.
Our fictious data set contains Research Methods final exam scores for 60 students enrolled in one of three majors – Sociology, Political Science, and Economics. The aim of our fictious study was to find out whether these exam scores differed based on students’ gender and college major.
A two-way ANOVA found that there was no significant interaction effect between major and gender. There was no significant main effect for gender but there was a significant main effect for major. We have decided to conduct “pairwise comparisons” to evaluate the differences between each pairing of the “levels” of this variable. That is, we will compare the mean Research Methods exam scores of Economics students with those of Political Science students, the mean scores of Economics students with those of Sociology students, and the mean scores of Political Science students with those of Sociology students.
Note that we only conduct pairwise comparisons for independent variables that have more than two levels. So, even if there had been a significant main effect for gender, we would not conduct pairwise comparisons for this variable.
Pairwise Comparisons
Click Analyze -> General Linear Model -> Univariate
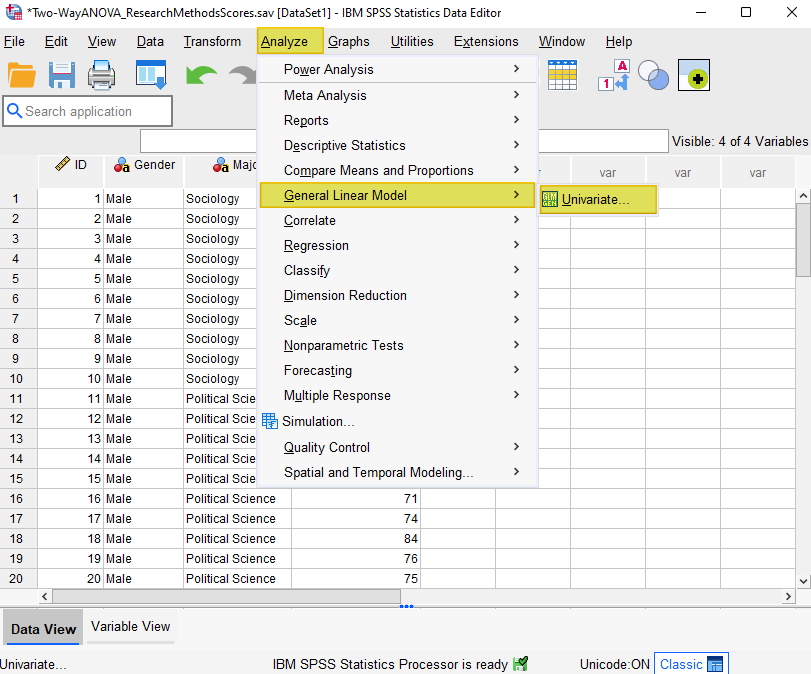
This brings up the Univariate dialog box.
If you ran a two-way ANOVA for the same data set in your current SPSS session, and you have not conducted analyses for other data sets since then, you should be looking at something like the following. That is, your dependent variable will appear in the Dependent Variable box and your independent variables will appear in the Fixed Factor(s) box.
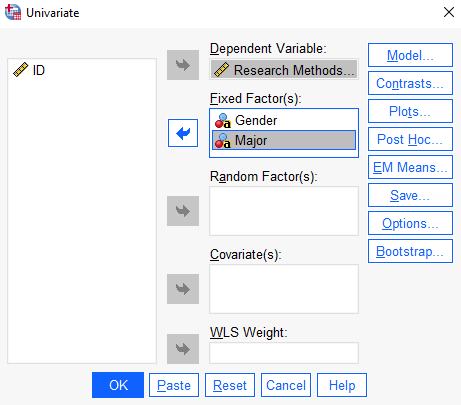
If you didn’t run a two-way ANOVA for the same data set in your current SPSS session, you can take the following steps.
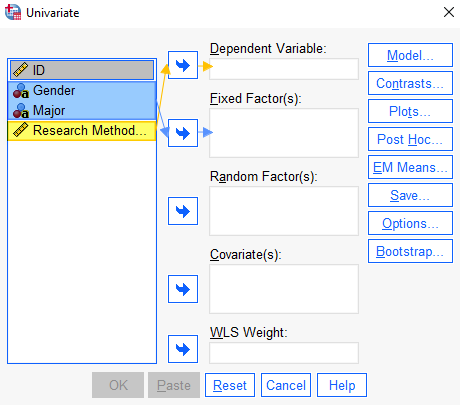
We suggest clicking the Reset button first to clear any previous settings.
As illustrated below, select your dependent variable (Research Methods Exam Score here) and use the arrow button to move it to the Dependent Variable box. Then, holding down the CTRL key, select your two independent variables (gender and major here) and use the arrow button to move them to the Fixed Factor(s) box.
Select the Post-Hoc button. This brings up the Univariate: Post Hoc Multiple Comparisons for Observed Means dialog box.
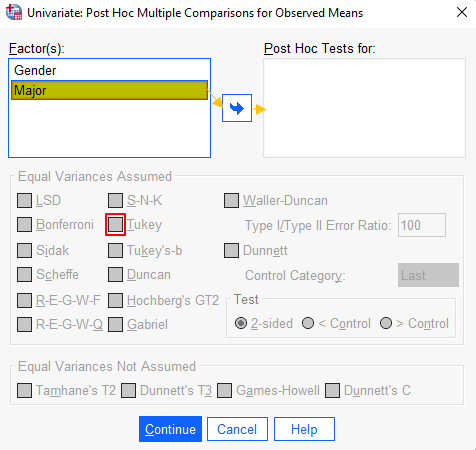
In the Factor(s) box, you will see your independent variables (gender and major in our example).
Use the arrow button to move independent variable(s) that have more than two levels and for which there is a significant main effect (major in our example) to the Post Hoc Tests for box. This will activate the Equal Variances Assumed box.
Remember that you don’t need to move independent variables that have only two levels to the Post Hoc Tests box.
In the Equal Variances Assumed box, select Tukey (and/or one of the other post-hoc options as desired).
Click Continue to return to the Univariate dialog box.
Click OK.
The SPSS Output Viewer will pop up with the results of your two-way ANOVA and your post-hoc tests – Tukey’s HSD (Honestly Significant Difference) test in our example.
Note that if you ran the original two-way ANOVA for your data set in the same session, and you didn’t un-check your selections in the “Options” and “Plots” dialog boxes, SPSS will include the descriptive statistics, estimates of effect size, Levene’s test, and profile plot in the Output Viewer again.
Results and Interpretation
You should see Multiple Comparisons table(s) that display the pairwise comparisons for each level of your independent variable(s).
In our example, these compare the mean Research Methods exam scores of Economics students with those of Political Science students, the mean scores of Economics students with those of Sociology students, and the mean scores of Political Science students with those of Sociology students. Note that there are six comparisons, rather than three, in this table because SPSS duplicates each pairing.
SPSS uses an asterisk to identify pairwise comparisons for which there is a significant difference at the .05 level of significance. In the screenshot below, the pairwise comparisons that have significant differences are identified by red boxes. Those with non-significant differences are identified by blue boxes.
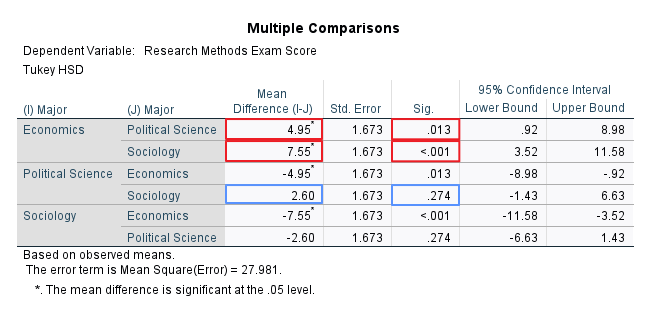
There is a 4.95% difference between the mean Research Methods exam scores of Economics and Political Science students. The asterisk next to this mean difference value highlights the fact that this difference is significant.
Similarly, the 7.55% difference between the mean scores of Economics and Sociology students is significant. Again, this is denoted by the asterisk next to the mean difference value.
In contrast, the 2.60 difference between the mean Research Methods exam scores of Political Science and Sociology students is not significant and there is no asterisk next to this value.
***************
That’s it for this tutorial.
You should now be able to perform pairwise comparisons in SPSS to determine which levels of your independent variable(s) are significantly different from the other levels of the same variable(s).
You may also be interested in our tutorials on: (1) reporting the results of a two-way ANOVA in APA style; and (2) exporting SPSS output to another application such as Word, Excel, or PDF.