The Split File option in SPSS allows you to split your dataset into subgroups so that you can run the same analyses for each subgroup. SPSS does not split your file physically. Rather it separates your analyses using the categorical variable that you have used to split – or group – your data. Examples of variables that you can use to group your data include gender, race, and college major.
Quick Steps
Split Your Data File
- Click Data -> Split File
- Select Compare groups (to see analyses for all groups in one table) or Organize output by groups (to see analyses for each group in separate tables)
- Move the variable(s) that you want to use to split – or group – your data into the Groups Based on box.
- Ensure that the Sort the file by grouping variables option is selected
- Click OK
Analyze the Data in Your Split File
- Analyze the data in your split file as needed.
Turn Off the Split File Option
- Click Data -> Split File
- Select Reset
- Click OK
The Data
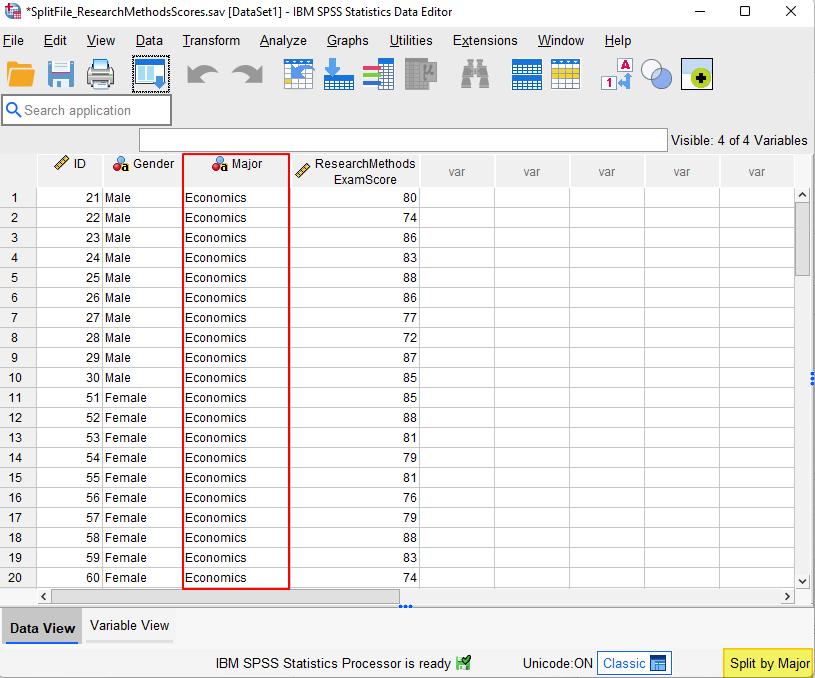
The starting assumption for this tutorial is that you have imported your data into SPSS, and that you’re looking at something like the following. (Check out our tutorials on importing data from Excel or MySQL into SPSS).
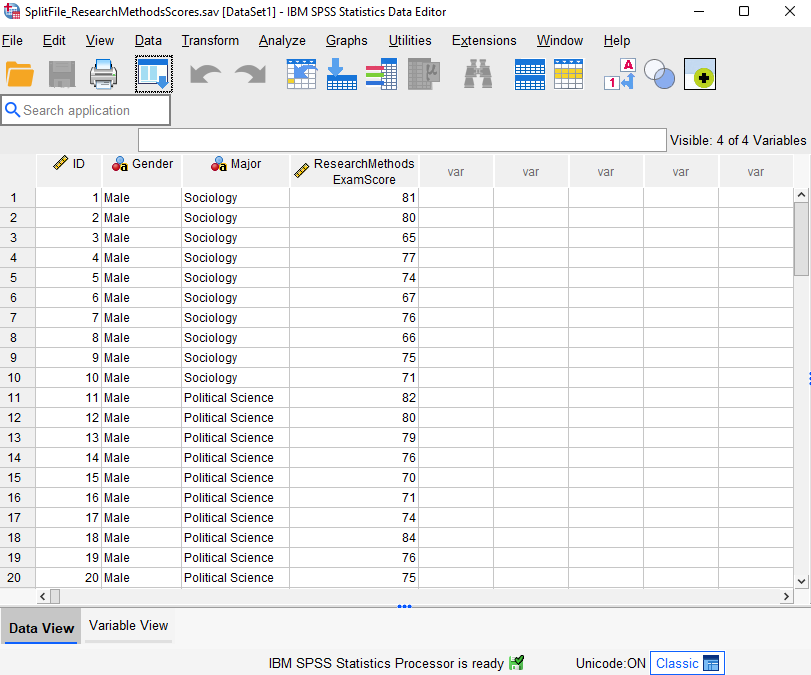
Our fictitious data set contains Research Methods exam scores for 60 students enrolled in one of three majors – Sociology, Political Science, and Economics.
We want to generate descriptive statistics for these exam scores grouped by students’ major. That is, we want to generate one set of descriptive statistics for the Research Methods exam scores of the students in the Sociology major, a second set for the students in the Political Science major, and a third set for the students in the Economics major.
Split the File
To split – or group – your data according to one (or more) of the categorical variables in your data set (major in this example), take the following steps.
Click Data -> Split File as illustrated below
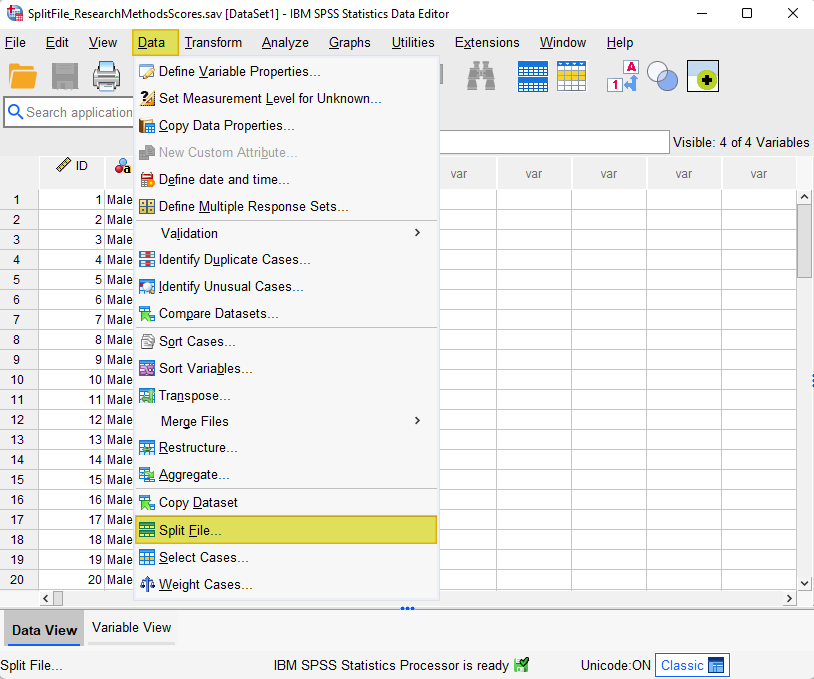
This brings up the Split File dialog box.
Select Compare groups if you want the results for all groups to be presented in the same table (illustrated in the first screenshot below). Alternatively, select Organize output by groups if you want the results for each group to be presented in separate tables (illustrated in the second screenshot below).
Select the variable(s) that you want to use to split your data (major in our example) and use the arrow button to move it into the Groups Based on box.
Ensure that the Sort the file by grouping variables option is selected.
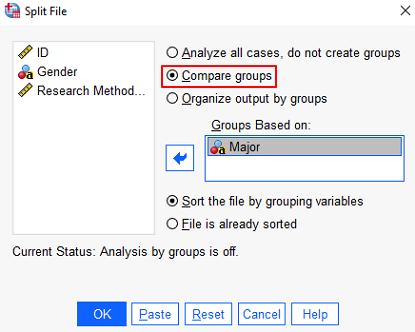
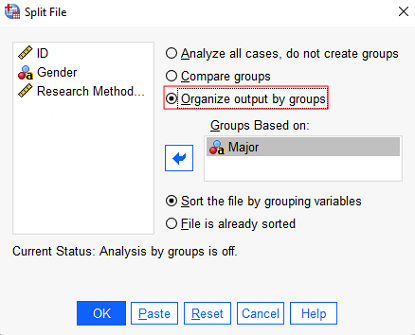
Click OK.
You will notice that your data has now been sorted on the grouping variable(s) that you selected. So in our example, you can see that all the students in the Economics major are grouped together because we split the file on major.
You will also see a note at the bottom right corner of the screen that tells you that your data set is currently split.
Analyze the Data in Your Split File
Once you have set up the split file option as described above, any subsequent analyses you run in your current SPSS session will be split according to your grouping variable (major in our example).
To illustrate split file analysis, we will generate descriptive statistics for the Research Methods exam scores grouped by students’ major. However, the split file functionality may be used for any analyses you perform on your data. The steps taken to produce descriptive statistics in this example are as follows.
- Click Analyze -> Descriptive Statistics -> Descriptives
- Click the Reset button to clear any previous settings (recommended).
- Select the dependent variable for which you want to generate descriptive statistics (Research Methods exam score in this example) and use the arrow to it to the Variable(s) box.
- Click OK
The SPSS Output Viewer will pop up with the results of your analysis.
The Results
If you selected the Compare groups option when you split your file, you will see the analysis for all your groups in one table. If you selected Organize output by groups you will see the results for each group (major in our example) presented in separate tables. The screenshots below illustrate the two options for the same data set.
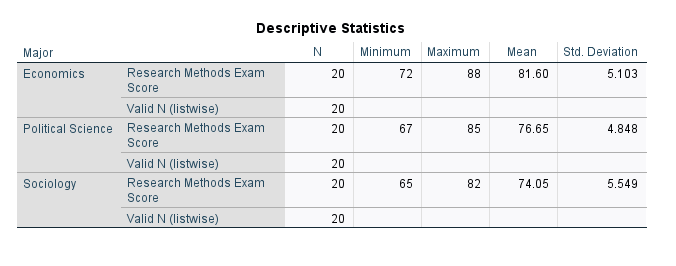
Example of Results: “Compare Groups” Option
The screenshot below illustrates that the way that descriptive statistics for Research Methods exam score appear with the Compare groups option.
Example of Results: “Organize Output by Groups” Option
Our second screenshot illustrates the way that the same descriptive statistics appear with the Organize output by groups option.
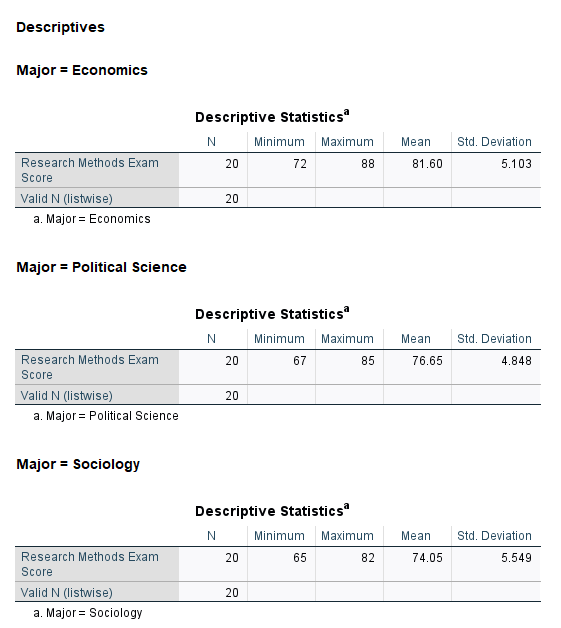
Note that the same data is presented in both of the above options.
Turn Off the Split File Option
If you don’t turn off the split file option, further analyses performed on the same data set in the current SPSS session will continue to be grouped by the variable you used to split your file. Therefore, once you have completed your analyses of subgroups in your dataset, it is important to turn off the split file function as follows.
Click Data -> Split File to bring up the Split File dialog box
Select Reset. After doing this, you will see that Analyze all cases, do not create option is selected as illustrated below.
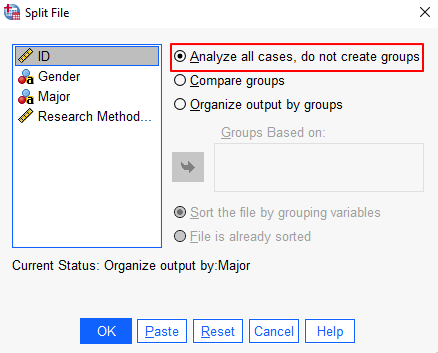
Click OK
You will also see that the “Split by [YOUR VARIABLE(s)]” message is no longer displayed at the bottom right corner of your Data Editor window.
***************
That’s it for this tutorial.
You should now be able to analyze subsets of your data using the Split File function in SPSS.