This quick tutorial will show you how to do Fisher’s exact test in SPSS. This test tends to be used when sample sizes are small, and you want to test whether two categorical variables (for example, gender and smoking status) are associated with each other.
Quick Steps
- Click on Analyze -> Descriptive Statistics -> Crosstabs
- Drag and drop (at least) one variable into the Row(s) box, and (at least) one into the Column(s) box
- Click on Statistics, select Chi-square, and then click on Continue
- Click on Exact, and then select the Exact option, leaving the test time limit as it is
- Press Continue, and then OK to run the test
- The result will appear in the SPSS output viewer
The Data
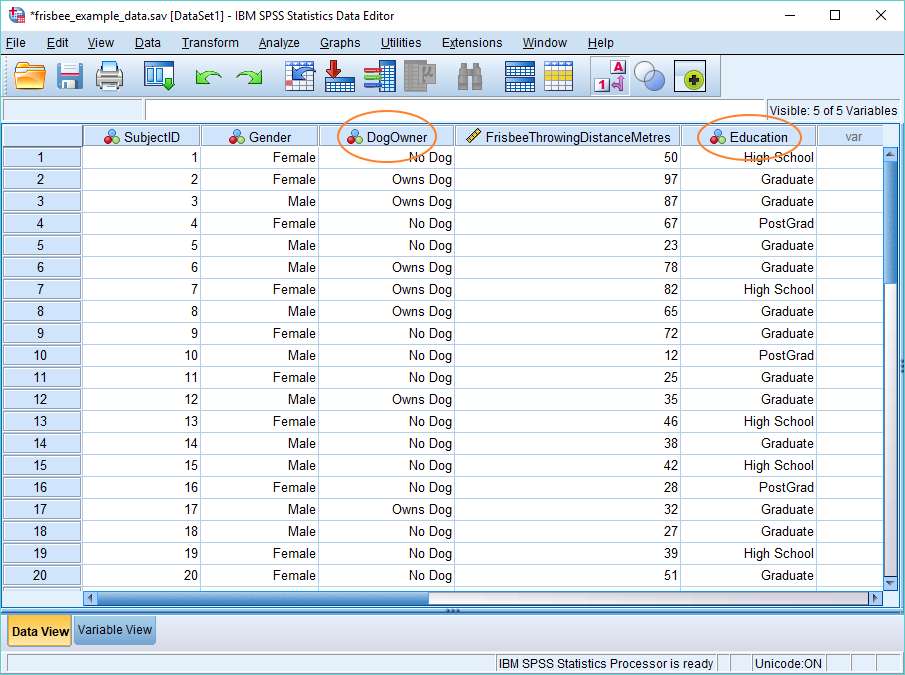
For this tutorial, we’re going to look at the association between level of education (High School, Graduate, PostGrad) and dog ownership (No Dog, Owns Dog). Our data looks like this in the SPSS Data View.
Fisher’s Exact Test
The procedure for doing Fisher’s exact test in SPSS is similar to that used for the chi square test. To start, click on Analyze -> Descriptive Statistics -> Crosstabs. The Crosstabs dialog will pop up.
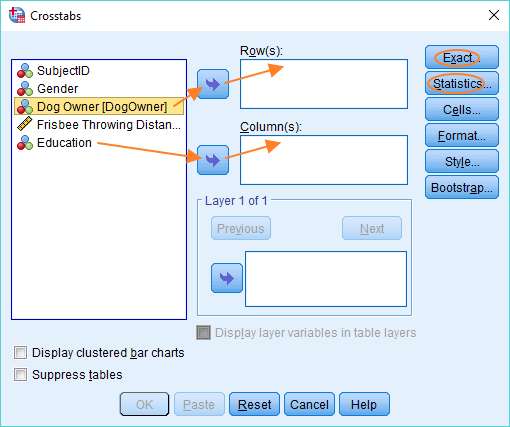
You’ll see your variables on the left. If you have more than two, as in our example, you need to identify which of the two you want to test for independence. One of these goes into the Row box, and the other into the Column box. It doesn’t matter which variable goes into which box. You can drag and drop, or use the arrows, as above.
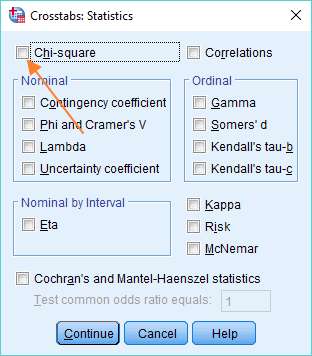
The first stage in configuring SPSS to run Fisher’s exact test is to set up a chi square test. To do this, click on Statistics, and choose the Chi-square option. Press Continue when you’ve made the selection.
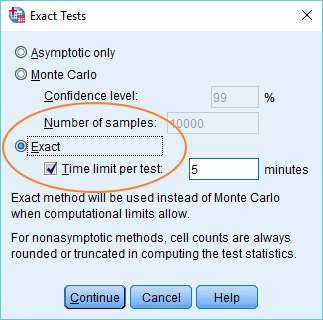
You should now be back at the Crosstabs dialog. It’s time to set up Fisher’s exact test. Hit the Exact button (top right within the Crosstabs dialog), and choose the Exact option, leaving the test time limit as it is.
Press Continue, and then OK to run the test.
The Result
You can view the test result in the SPSS output viewer. It’ll look something like this.
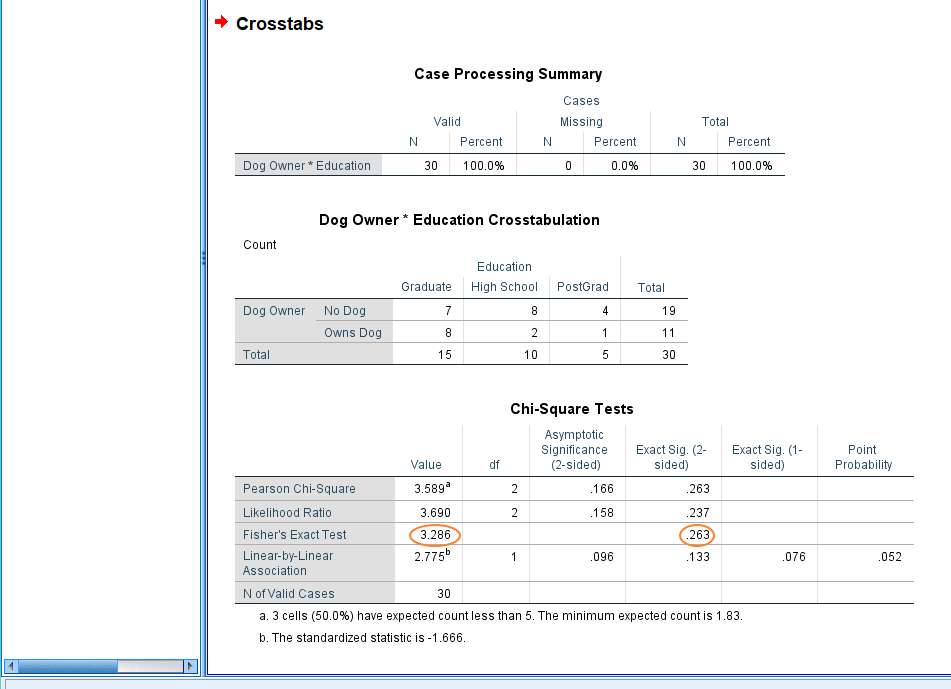
As you can see above, the value of the Fisher’s exact test statistic is 3.286. This results in a p value of .263. Normally this would not be considered significant (given an alpha level of .05, for example). The Pearson Chi-Square test statistic (3.589) similarly does not reach significance. Therefore, in this instance, we have no grounds to reject the null hypothesis that states there is no association between level of education and dog ownership.
It’s worth noting one other thing. If your Crosstabs table is a 2×2 table – that is, if you’re comparing two categorical variables that have only two values each, then Fisher’s exact test will run automatically. But in a case like this one, where one of the variables has more than two possible values, it won’t run unless you choose the Exact option under the Exact Tests dialog.
***************
That’s the end of this quick tutorial. You should now know how to do Fisher’s exact test in SPSS, and also have an idea about how to interpret the result. You may also be interested in our tutorials on: (1) exporting your SPSS output to another application such as Word, Excel, or PDF; and (2) how to report Fisher’s exact test from SPSS in APA style.
***************
EZSPSS on YouTube
Our video tutorial uses different data, and shows how to do Fisher’s Exact Test with a 2×2 contingency table.. Check it out!