This quick tutorial will show you how to calculate the skewness and kurtosis of a distribution in the SPSS statistics package.
Quick Steps
- Click on Analyze -> Descriptive Statistics -> Descriptives
- Drag and drop the variable for which you wish to calculate skewness and kurtosis into the box on the right
- Click on Options, and select Skewness and Kurtosis
- Click on Continue, and then OK
- Result will appear in the SPSS output viewer
The Data
As is the norm with these quick tutorials, we start from the assumption that you have already imported your data into SPSS, and your data view looks something a bit like this.
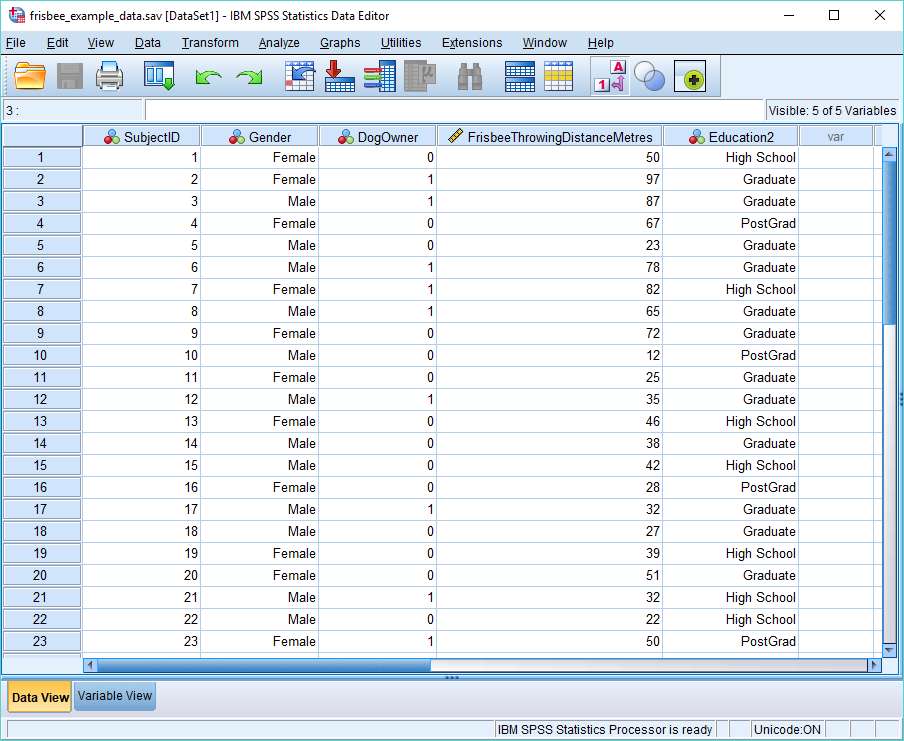
Skewness is a measure of the symmetry, or lack thereof, of a distribution. Kurtosis measures the tail-heaviness of the distribution. We’re going to calculate the skewness and kurtosis of the data that represents the Frisbee Throwing Distance in Metres variable (see above). The usual reason to do this is to get an idea of whether the data is normally distributed.
Calculate Skewness and Kurtosis
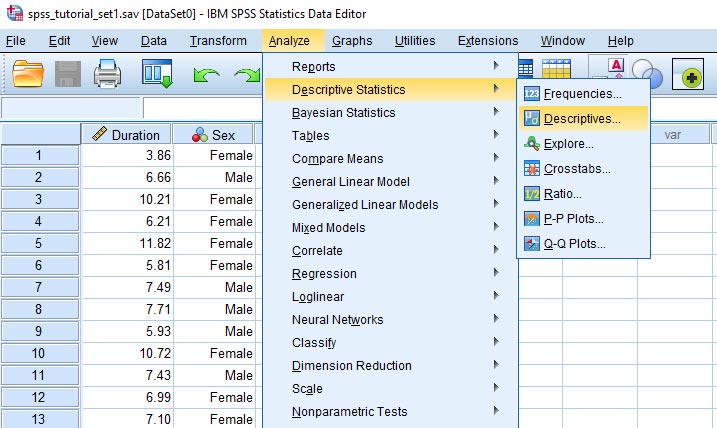
There are a number of different ways to calculate skewness and kurtosis in SPSS. We’re going to use the Descriptives menu option.
To begin the calculation, click on Analyze -> Descriptive Statistics -> Descriptives.
This will bring up the Descriptives dialog box. You need to get the variable for which you wish to calculate skewness and kurtosis into the box on the right. You can drag and drop, or use the arrow button, as shown below.
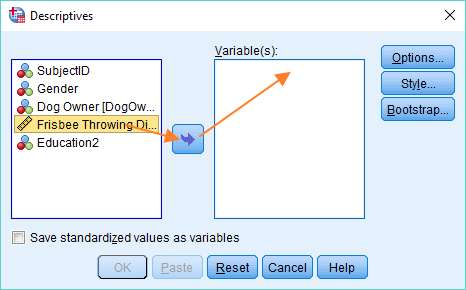
Once you’ve got your variable into the right hand column, click on the Options button. This will bring up the Descriptives: Options dialog box, within which it is possible to choose a number of descriptive measures.
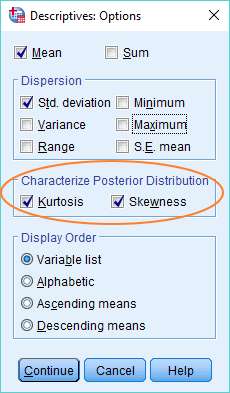
To calculate skewness and kurtosis, just select the options (as above). You’ll notice that we’ve also instructed SPSS to calculate the mean and standard deviation.
Once you’ve made your selections, click on Continue, and then on OK in the Descriptives dialog to tell SPSS to do the calculation.
The Result
The result will pop up in the SPSS output viewer. It will look something like this.
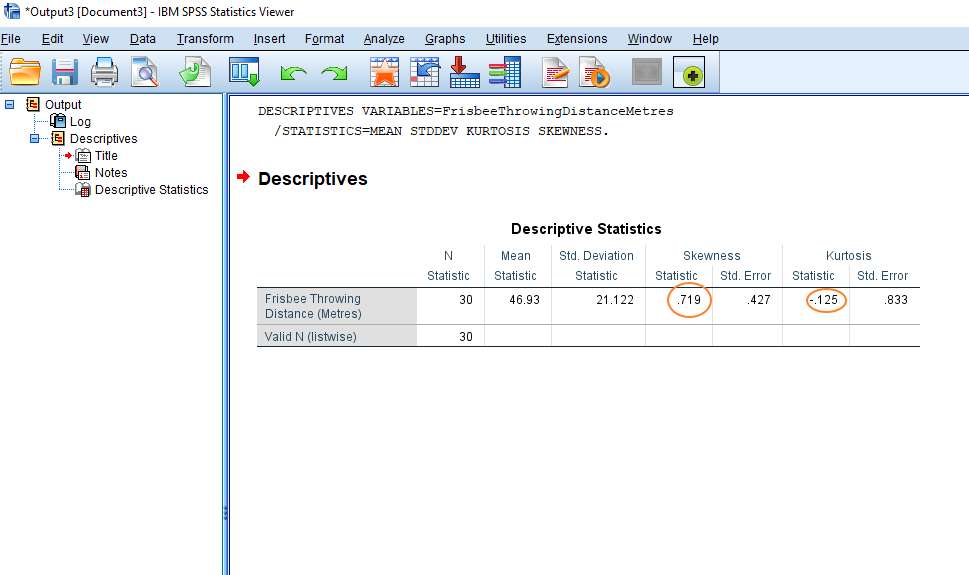
This is fairly self-explanatory. The skewness statistic is .719 and kurtosis is -.125 (see above). You can also see that SPSS has calculated the mean (46.93 metres) and the standard deviation (21.122 metres). N represents the number of observations.
***************
Okay, that’s it for this quick tutorial. You should now be able to calculate statistics for skewness and kurtosis in SPSS. Check out our tutorial on exporting your SPSS output to another application such as Word, Excel, or PDF.