This quick tutorial will show you how to calculate percentiles in SPSS using the default HAVERAGE method.
Quick Steps
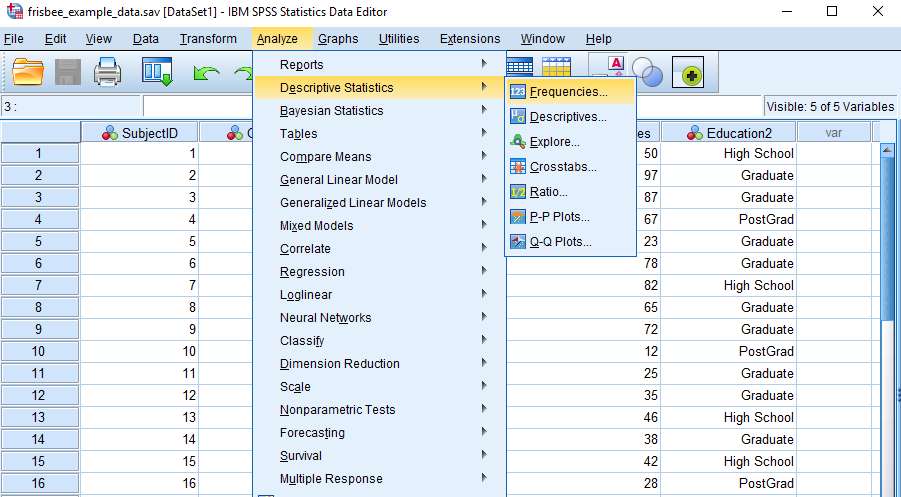
- Click on Analyze -> Descriptive Statistics -> Frequencies
- Drag and drop the variable for which you wish to calculate the percentile(s) into the box on the right
- Click the Statistics button
- Select the Percentile(s) option, type the percentile value into its textbox, and then click the Add button
- Repeat for all the percentiles you want to calculate
- Click Continue, and then OK
- Percentile values will appear in the SPSS output viewer
The Data
A percentile is the value in a data distribution below which a given percentage of values falls. For example, the 25th percentile (also known as the first quartile) is the value below which 25% of the values fall.
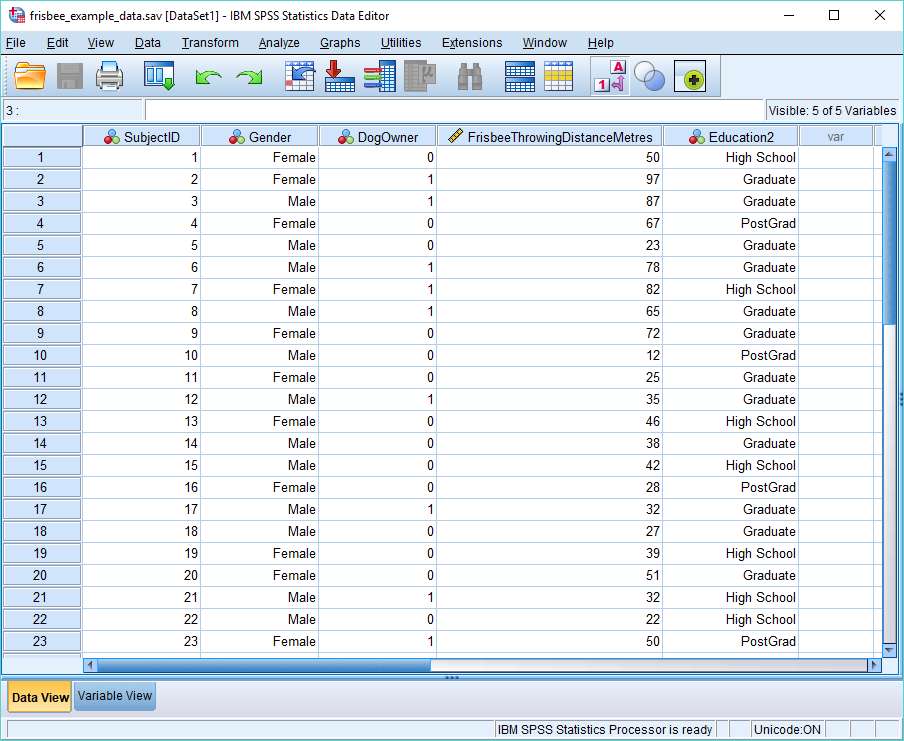
We’re going to calculate the 25th and 83rd percentiles for the Frisbee Throwing Distance in Metres variable (as shown in the SPSS data view above).
Calculate Percentiles
There are a number of different ways to calculate percentiles in SPSS, and also a number of different formulae. We’re going to use the Frequencies option, which calculates percentiles using a weighted average formula.
To begin the calculation, click on Analyze -> Descriptive Statistics -> Frequencies.
This will bring up the Frequencies dialog box. You need to get the variable for which you wish to calculate the percentile(s) into the box on the right. You can drag and drop, or use the arrow button, as shown below.
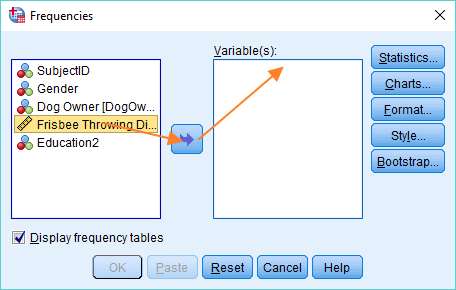
Once you’ve got your variable into the right column, hit the Statistics button. The Frequencies: Statistics dialog will pop up. As you can see this allows you to choose from a variety of measures.
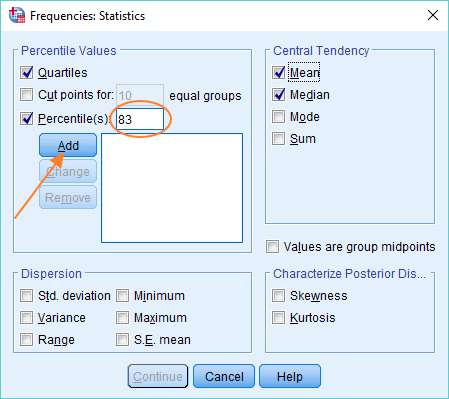
To add a percentile of your choice, select the Percentile(s) option, type the percentile value into the textbox (where we’ve got 83), and then click the Add button. You can repeat this process if you want SPSS to calculate additional percentiles.
You’ll see above that we’ve also selected Quartiles (which will generate the 25th, 50th and 75th percentiles), and the Mean and Median. Once you’ve made your selection, click the Continue button, and then click OK in the Frequencies dialog to prompt SPSS to do the calculations.
The Result
The result will appear in the SPSS output view. It will look a bit like this.
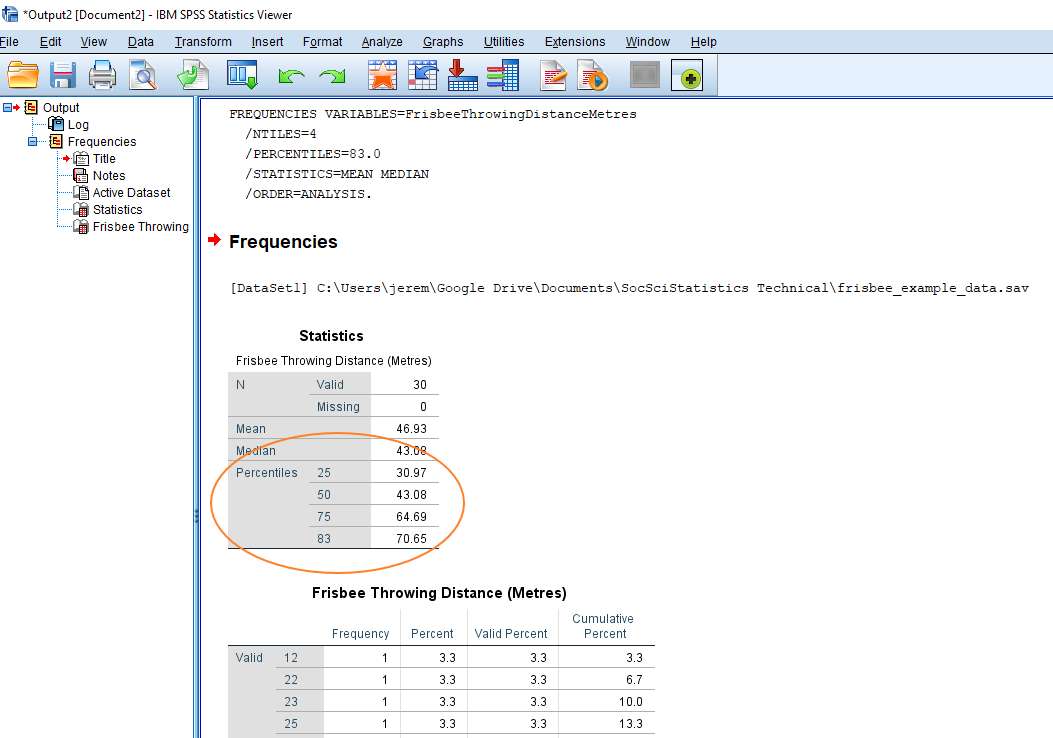
As you can see, it’s pretty self-explanatory. The percentile values appear in the Statistics table. The value for the 25th percentile is 30.97 and the value of the 83rd percentile is 70.65. You’ll notice that SPSS has also calculated values for the Mean and Median, as we requested.
***************
That’s really all there is to it. You should now be able to calculate percentiles using the Frequencies option in SPSS. You may also be interested in our tutorial on exporting your SPSS output to another application such as Word, Excel, or PDF.