In this tutorial we show you how to report the results of Fisher’s exact test from SPSS in APA style. For additional information about formatting your reports, please refer to the APA Style website
First, we present a template that you can use to report your Fisher’s exact test in APA style. Then we show you how to populate this template using your own SPSS output. Finally, we present an example of a report of Fisher’s exact test written using our template.
Note: for the sake of simplicity, we make the assumption that you conducted a “two-tailed” Fisher’s exact test.
Template for Reporting Fisher’s Exact Test in APA Style
Our template for reporting your Fisher’s exact test is below. Replace the [blue bold text in square brackets] with information from your own Fisher’s exact test. The (red numbers in parentheses) correspond to numbers on the screenshot of selected SPSS output below and to our tips for writing your report (also below).
APA Template Text
The results of Fisher’s exact test (p = [value of p] (1)) [indicate/do not indicate] (2) a significant association between [variable 1] and [variable 2].
How to Populate Our Fisher’s Exact Test APA Template With Your SPSS Output
The APA Style Guide states: (a) that the first line of each paragraph should be indented 0.5 inches from the left margin; and (b) that the text should be double-spaced.
(1) Report the exact p value as per the Exact Sig. (2-sided) column for the Fisher’s Exact Test row of the “Chi-Square Tests” table to two or three decimal places as per the SPSS output. However, if the p value is .000, report it as < .001. Do not add a leading zero to your p value.
The screenshot below is from a Fisher’s exact test that we performed in SPSS to determine whether there was an association between level of education and dog ownership.
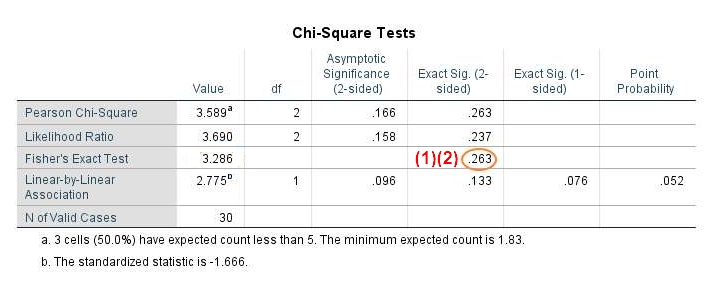
(2) A significant association between your two variables is indicated if the p value referenced in (1) above is less than or equal to the alpha level that you selected for your test. An alpha level of .05 is typical. The p value for our example (.263) is greater than our alpha level of .05 indicating that there isn’t a significant association between level of education and dog ownership.
We encourage you to tweak the wording of our template to suit your own Fisher’s exact test as appropriate.
Example of a Fisher’s Exact Test Reported in APA Style
The results of Fisher’s exact test (p = [.263]) [do not indicate] a significant association between [level of education] and [dog ownership].
***************
That’s it for this tutorial. You should now be able to report Fisher’s exact test performed in SPSS in APA style.
***************