In this tutorial, we show you how to report a one sample t test performed in SPSS in APA style. For additional information about formatting reports, please refer to the APA Style website.
First, we provide a template that you can use to report your one sample t test in APA style. Then we show you how to populate this template using the SPSS output from your own t test. Finally, we show you an example of a one sample t test report written using our template.
Template for Reporting One Sample t Tests in APA Style
A template for reporting your one sample t test is below. For the sake of simplicity, we are making the assumption that you performed a “two-tailed” one sample t test. That is, we are assuming that you performed a one sample t test to evaluate whether there was a difference in any direction between your sample and the population with which you compared it.
To put this another way, we are assuming that you did not run a “one-tailed” one sample t test. You would use a “one-tailed” test to evaluate whether any difference between your sample and your comparison population ran in a specific direction. An example of a one-tailed one sample t test would be if you evaluated whether children of immigrant parents in America weigh less than the general population of American children.
The [blue bold text in square brackets] in the template needs to be replaced with information from your own t test. The (red numbers in parentheses) correspond to numbers on the screenshots of selected SPSS output below and/or our notes and tips for writing your report in APA style (also below).
APA Template Text
A one sample t test was performed to evaluate whether there was a difference between the [variable of interest] in [description of sample] compared to [description of population]. The mean [variable of interest] in [description of sample] (M = [mean] (1), SD = [standard deviation] (2)) [was significantly more/was significantly less/was not significantly different] (3a and 3b) than in the [description of population], t([df](4)) = [value of t](5), p = [value of p](6).
Using Your SPSS Output to Populate Our One Sample t Test APA Template
Finding the Information You Need in the SPSS Output
The numbers in the screenshots of SPSS output below correspond to those in our APA reporting template above. Use the values from your own SPSS output to populate the template.
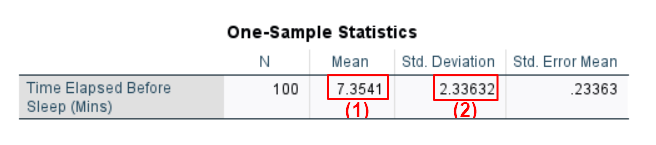
In our example, our variable of interest is the amount of time that elapses before sleep. Our sample is people in a statistics class. The population with which we are comparing our sample is the general population. In other words, we want to find out whether the amount of time it takes people to fall asleep in a statistics class is different from the amount of time it takes the general population to fall asleep. Selected screenshots from our SPSS output for this one sample t test is below.
Notes and Tips for Writing Your Report in APA Style
The APA Style Guide states: (a) that the first line of each paragraph should be indented 0.5 inches from the left margin; and (b) that the text should be double-spaced.
(1) Report the mean to two decimal places.
(2) Report the standard deviation to two decimal places.
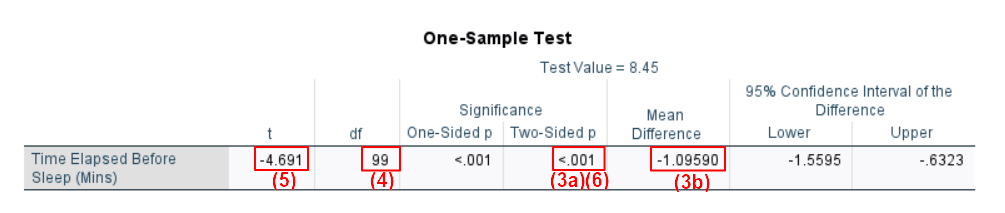
(3a) Your one sample t test is significant if the p value in the “two-sided p” column (3a) is less than or equal to the alpha level you selected for your test. An alpha level of .05 is typical. As noted above, our assumption is that you ran a two-tailed one sample t test to evaluate whether there was a significant difference in either direction between your sample and the population with which you compared it. So, in our example, we are evaluating whether the amount of time it takes people to fall asleep in a statistics lesson is significantly different than the amount of time it takes the general population to fall asleep.
(3b) If the value listed in the mean difference column is negative, then the measure of your variable of interest is less for your sample than it is for your comparison population. The value in the SPSS output for our example one sample t test is negative, meaning that it took less time for people to fall asleep in a statistics class than it took for the general population to fall asleep. If the value listed in the mean difference column is positive, the measure of your variable of interest is more for your sample than it is for your comparison population.
(5) Report the value of t to two decimal places. If your t value is smaller than +1.00/-1.00, add a leading zero (e.g., write 0.96 rather than .96). If the value of t is negative, you can opt to report it as a positive value. So, in our example, we report 4.69 rather than -4.69
(6) Report the exact p value to two or three decimal places as per the SPSS output. However, if the p value is .000, report it as < .001. Do not add a leading zero to your p value – note that we have used < .001 rather than < 0.001 in our example below.
We encourage you to tweak the wording of our template to suit your own t test and to ensure that it reads well.
Example of a t Test Report in APA Style
A one sample t test was performed to evaluate whether there was a difference between the [amount of time it takes people to fall asleep] in [a statistics lesson] compared to [in the general population]. The mean [amount of time (in minutes) that it took people to fall asleep] in [a statistics lesson (M = [7.35], SD = [2.34]) [was significantly less] than in [the general population], t([99]) = [4.69], p = [< .001].
***************
That’s it for this tutorial. You should now be able to report a one sample t test performed in SPSS in APA style.
***************