In this tutorial we show you how to report a Mann-Whitney U test from SPSS in APA style. For additional information about formatting your reports, please refer to the APA Style website.
First, we provide a template that you can use to report your test in APA style. Then we show you how to populate this template using the SPSS output from your own test. Finally, we show you an example of a Mann-Whitney U test report written using our template.
Template for Reporting a Mann-Whitney U Test from SPSS in APA Style
A template for reporting your Mann-Whitney U test is below. For the sake of simplicity, we are making the assumption that you performed a “two-tailed” test. That is, we are assuming that you performed a Mann-Whitney test to evaluate whether the dependent variable differed in any direction between your two groups. Replace the [blue bold text in square brackets] in the template with information from your own Mann-Whitney U test. The (red numbers in parentheses) correspond to numbers on the screenshots of SPSS output below and/or to our notes and tips for writing your report (also below).
Template for Reporting a Mann-Whitney U Test
A Mann-Whitney U test was performed to evaluate whether [dependent variable] differed by [independent variable].
The results indicated that (1) there was no significant difference between the [dependent variable] of [group X of independent variable] and [group Y of independent variable] OR [group X of independent variable] had significantly higher/lower (2) [dependent variable] than [group Y of independent variable], U = [value of Mann-Whitney U] (3) (5) OR z = [value of z] (4) (5), p = [value of p] (6).
Populating the Mann-Whitney U Test Template with SPSS Output
The screenshots below are from a Mann-Whitney U test that we performed on a fictitious data set to evaluate whether there was a significant difference between the frisbee throwing distances of dog owners and non-dog owners. The numbers on the screenshots correspond to numbers in the APA template above. Take the corresponding values from your own SPSS output and use them to populate the template.
The APA Style Guide states: (a) that the first line of each paragraph should be indented 0.5 inches from the left margin; and (b) that the text should be double-spaced.
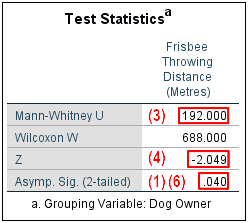
(1) Use the text highlighted in yellow if there was no significant difference between the two groups in your study (dog owners and non-dog owners in our example) Use the text highlighted in gold if there was a significant difference between the two groups. The difference is significant if the p value in the Test Statistics table is less than or equal to the alpha level you selected for your text. An alpha level of .05 is typical. In our example, the only p value listed is “Asymp. Sig. (2-tailed) but, if you have a small sample size, you may also see an “Exact Sig. (2-tailed) p value in the SPSS output for your test. If so, report this (Exact. Sig) value.
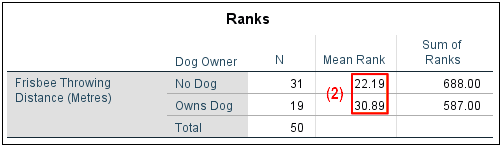
(2) The easiest way to determine which of the two groups in your study has a higher (or lower) amount of the dependent variable (frisbee throwing distance in our example) is to review the Ranks table. In our example, we can see that frisbee throwing distances for dog owners (mean rank of 30.89) are higher (greater) than those for non-dog owners (mean rank of 22.19). Select an appropriate adjective to compare the two groups in your study, e.g., higher, lower, greater, faster, etc.
(3) Report the value of Mann-Whitney U from the Test Statistics table in the SPSS output to two decimal places.
(4) The value of z for a Mann-Whitey U test in the Ranks table of the SPSS output will always be negative. Report this value to two decimal places. If the z value is less than – 1.000, you should add a leading zero. For example, you would report – .041 as – 0.04.
(5) If the number of cases in both of the groups you are comparing is 20 or less, report U, using the text highlighted grey. If the number of cases in one or both of these groups is greater than 20, report z, using the text highlighted pink. In our example, the number of cases in the no dog group is greater than 20 (31), so we will report z.
(6) Report the exact p value to two or three decimal places as per the SPSS output. However if the p value is .000, report it as < .001. You should not add a leading zero to your p value.
We encourage you to tweak the wording of the template as needed for your own test and to ensure that the report conveys your results in a way that is easy to understand.
Example of a Mann-Whitney U Test Report in APA Style
A Mann-Whitney U test was performed to evaluate whether [a person’s frisbee throwing distance] differed by [dog ownership].
The results indicated that [dog owners] had significantly greater [frisbee-throwing distances] than [non-dog owners], z = [-2.05], p = [.040].
**************
That’s it for this tutorial. You should now be able to report the results of a Mann-Whitney U test from SPSS in APA style.
***************