In this quick tutorial, we’ll explain how to do a one sample t test (or single sample t test) in SPSS, and also how to interpret the result.
Quick Steps
- Analyze -> Compare Means -> One-Sample T Test
- Drag and drop the variable you want to test against the population mean into the Test Variable(s) box
- Specify your population mean in the Test Value box
- Click OK
- Your result will appear in the SPSS output viewer
The Data
Our working assumption, as per usual, is that you’ve opened SPSS, and that you’re looking at the Data View within which you’ve got some data.
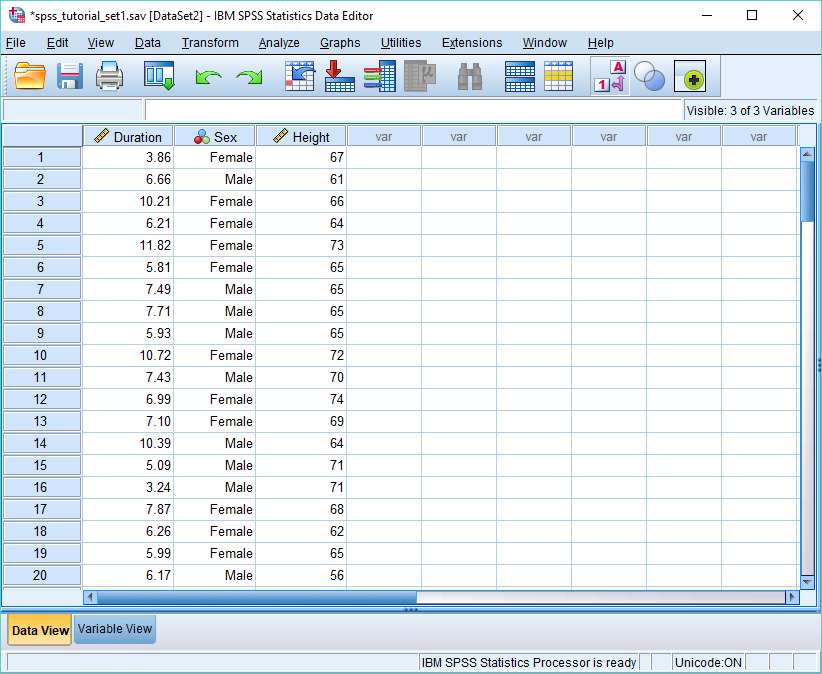
Our data is from a hypothetical study that examines how long it takes people to fall asleep during a statistics lesson.
For the purpose of this tutorial, we’re only interested in the Duration variable, which is the number of minutes that elapses from the start of the lesson before a subject falls asleep.
Imagine we already know that in the population as a whole the average amount of time it takes for somebody to fall asleep is 8.45 minutes. This compares to the average time in our sample of 7.35 minutes. The question is whether the difference between these two means is large enough for us to conclude there is a real difference between our sample group and the wider population in terms of the amount of time it takes to fall asleep.
If we knew the population standard deviation, we could do a z test to answer this question, but we don’t, which means a one sample t test is the appropriate test.
One Sample T Test
To begin the one sample t test, click on Analyze -> Compare Means -> One-Sample T Test. This will bring up the One-Sample T Test dialog box.
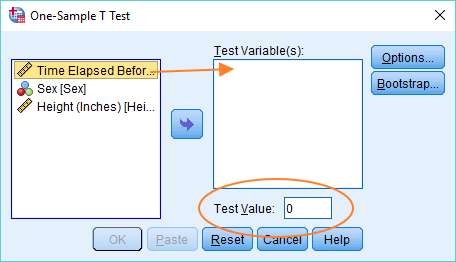
You’ve got to get the variable you want to test – in our case, the Duration variable – into the right hand Test Variable(s) box, and input the population mean into the Test Value box. For the variable, you can just drag and drop, or use the arrow in the middle of the dialog box.
Once it’s set up, it should look like this.
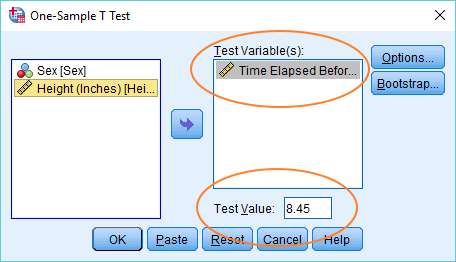
If you’ve got this far, you’re ready to run the test. Just hit the OK button.
The Result
The result of the one sample t test will appear in the SPSS output viewer. It will look like this.
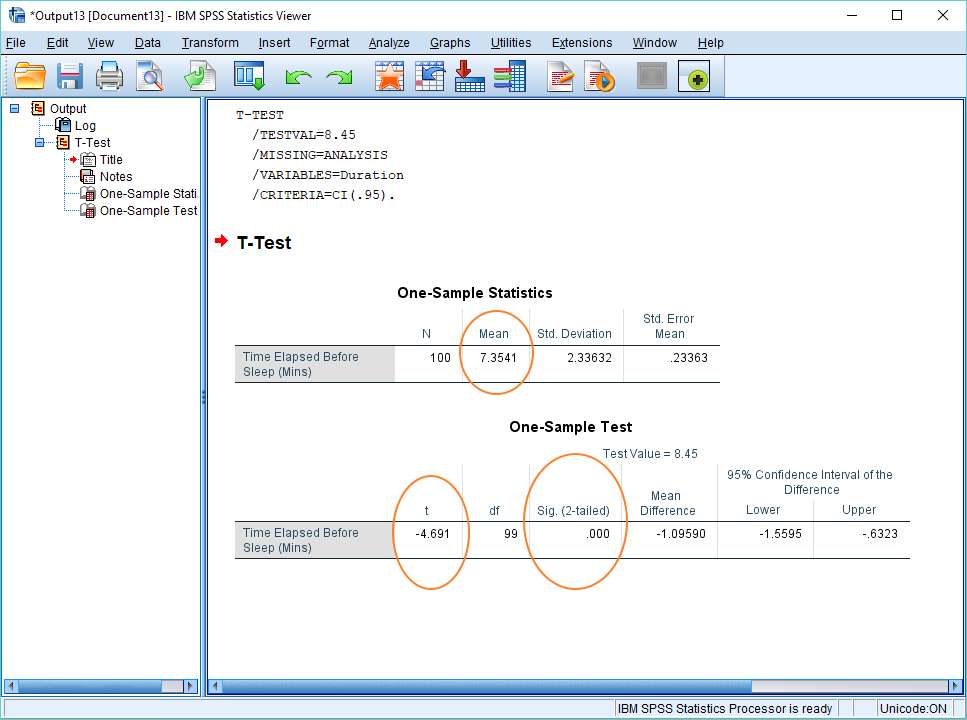
This output is relatively easy to interpret.
The t value is -4.691 (see the One-Sample Test table, above), which gives us a p-value (or 2-tailed significance value) of .000. This is going to be a significant result for any realistic alpha level.
A standard alpha level is .05, and .000 is smaller than .05, so we’re going to reject the null hypothesis which asserts there is no difference between our sample mean and the population mean.
More technically, what the result shows is that on the assumption that the null hypothesis is true, a difference as big as we’ve got between our sample mean and the population mean is extremely unlikely to have arisen purely by chance.
This counts as evidence that the difference between our sample group and the population as a whole is real. Put simply, it seems that our subjects fall to sleep in statistics lessons more quickly than is true of the population as a whole.
***************
Okay, that’s it for this quick tutorial. You should now be able to run a one sample t test in SPSS, and to interpret the result that you get. You may also be interested in our tutorials on: (1) exporting your SPSS output to another application such as Word, Excel, or PDF; and (2) reporting one sample t tests from SPSS in APA style.