A population pyramid is a chart that allows us to visualize the distribution of a population by age and gender. In this tutorial we will show you how to create a population pyramid in SPSS.
Quick Steps
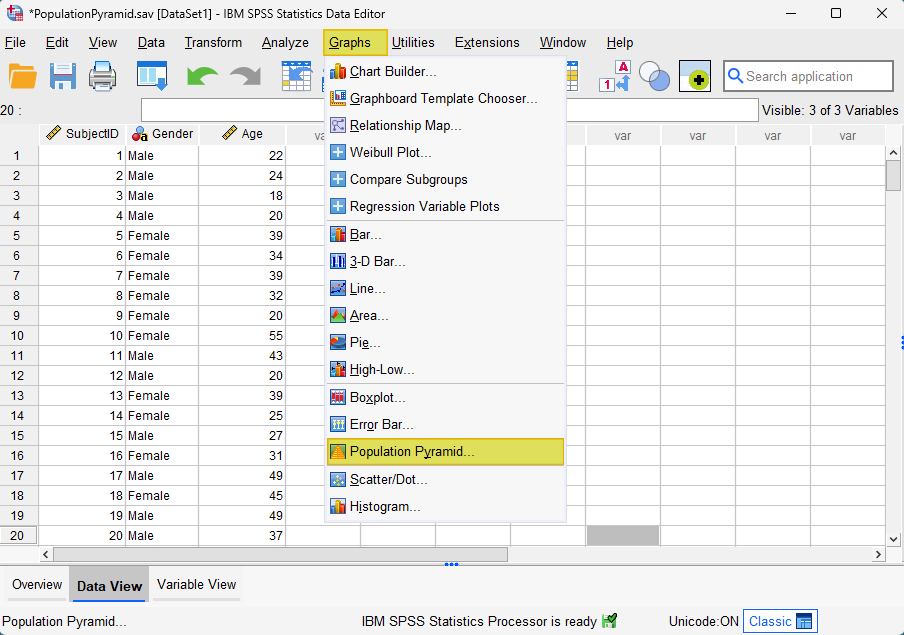
- Click Graphs -> Population Pyramid (in newer versions of SPSS) OR
Click Graphs -> Legacy Dialogs -> Population Pyramid (in older versions of SPSS) - Click Reset (recommended)
- Move your age variable to the Show Distribution over box
- Move your gender variable to the Split by box
- Select Scale Options if you wish to add display a normal curve or customize bin sizes (optional)
- Click Titles to add a title (recommended)
- Click OK
The Data
The first step is to import your data into SPSS. Check out our tutorials on importing data from Excel and MySQL.
Our data set for this tutorial contains the age and gender of the members of a fictitious yoga club.
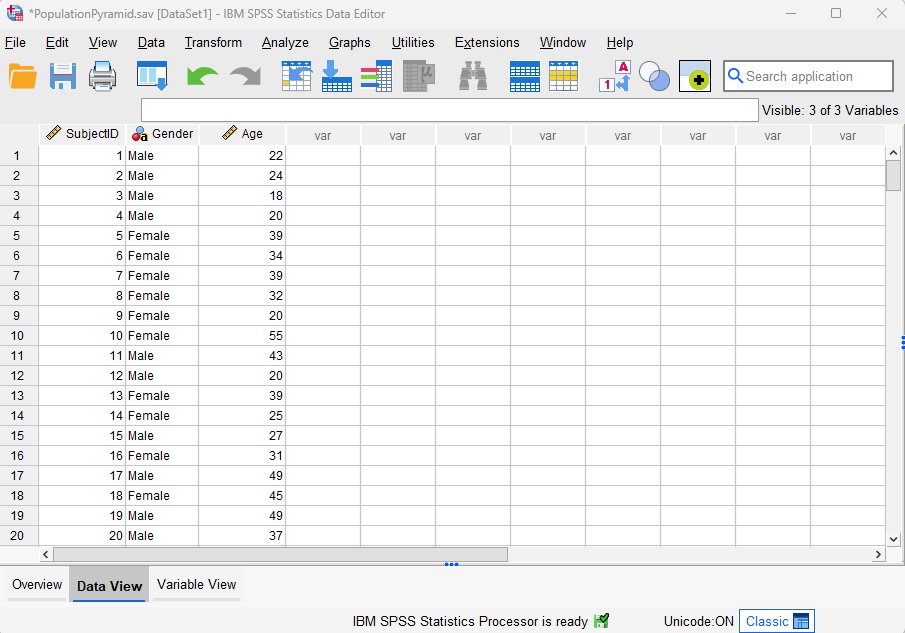
We want to generate a population pyramid that will show us the distribution of our yoga club members by age and gender.
Create a Population Pyramid
The quickest and easiest way to create a population pyramid in SPSS is as follows.
In newer versions of SPSS, click Graphs ->Population Pyramid as illustrated below. Note, however, that in older versions of SPSS, you will need to click Graphs -> Legacy Dialogs -> Population Pyramid.
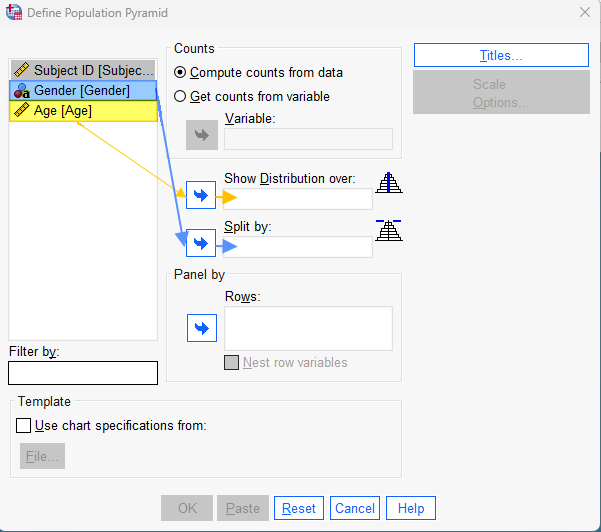
This brings up the Define Population Pyramid dialog box. We recommend that you click Reset to clear any previous settings before continuing with the other steps.
Select your age variable, and use the arrow button to move it to the Show Distribution over box. Then, select your gender variable, and use the arrow button to move it to the Split by box. Your dialog box should now look something like the one below:
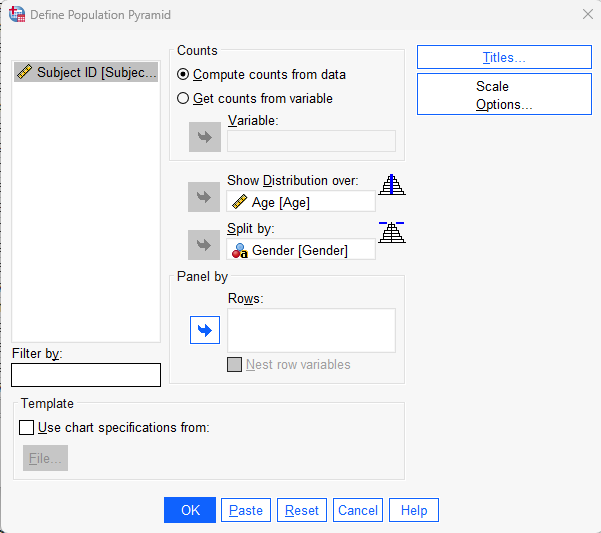
When you move your age and gender variables as above, you activate the Scale Options button. If you click this button, you will bring up the Population Pyramid: Scale Options dialog box illustrated below.
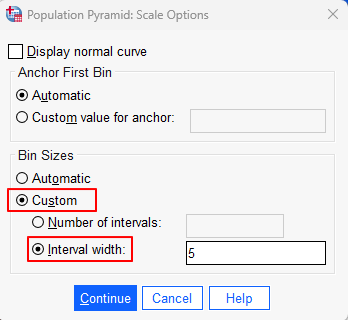
In this dialog box, the following options are available:
Firstly, you can check the Display Normal Curve box to add a normal curve to your population pyramid. We will not select this option in this tutorial.
Secondly, you can customize the width of the intervals or “bins” for the age variable. In our example, we set 5-year intervals as follows. First, we select the Custom button under Bin Sizes. Next, we select the Interval width button. Then we type “5” in the Interval width box.
Once you have selected your preferred options, select Continue to return to the main Define Population Pyramid dialog box.
We recommend that you add a title to your population pyramid. To do this, select the Titles button, then type your desired chart title. Select Continue to return to the Define Population Pyramid dialog box.
Click OK.
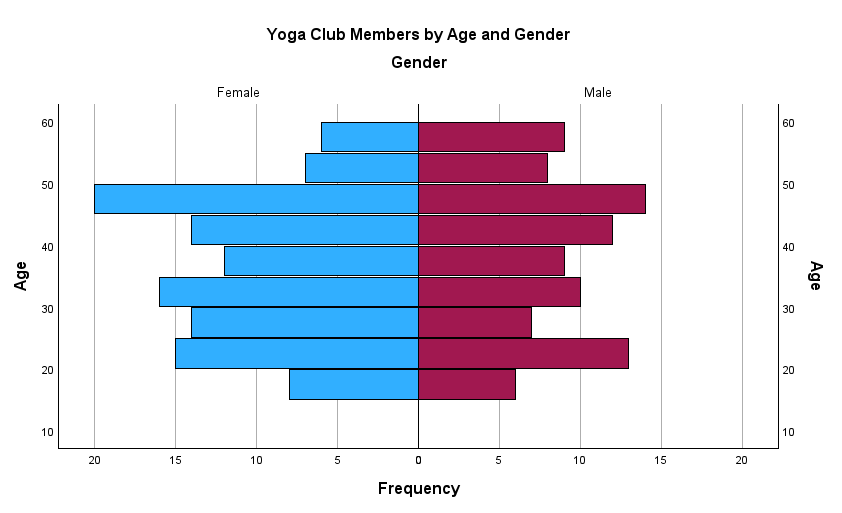
The Population Pyramid
The SPSS Output Viewer will pop up with the population pyramid that you have created. Our example below illustrates the age and gender breakdown of our fictitious yoga club.
If you want to save your population pyramid, you can right-click on it within the Output Viewer, and copy it as an image file. You can then use this file in other programs.
***************
That’s it for this quick tutorial. You should now be able to create a population pyramid in SPSS.
***************