In this quick tutorial, we’ll show you how to find the mode for one or more variables in SPSS.
Quick Steps
- Click Analyze -> Descriptive Statistics -> Frequencies
- Click Reset (recommended)
- Move the variable(s) for which you want to calculate the mode to the Variable(s) box on the right
- Ensure that the Display frequency tables box is checked.
- Click Statistics
- Place a check in the Mode check box
- Click Continue
- Click OK
The Mode
The mode is the score or category that appears most frequently in a set of values. Like, the mean and the median, the mode is a measure of central tendency. The mode can be calculated for variables recorded on any scale of measurement (ratio, interval, ordinal, or nominal), but it is especially useful for nominal data. Nominal data is data that can be categorized, but that can cannot be ordered or measured numerically. Examples of nominal data include race, marital status, and nationality.
Some sets of values have more than one mode. A bimodal set of values has two modes, while a multimodal set of values has more than two modes.
The Data
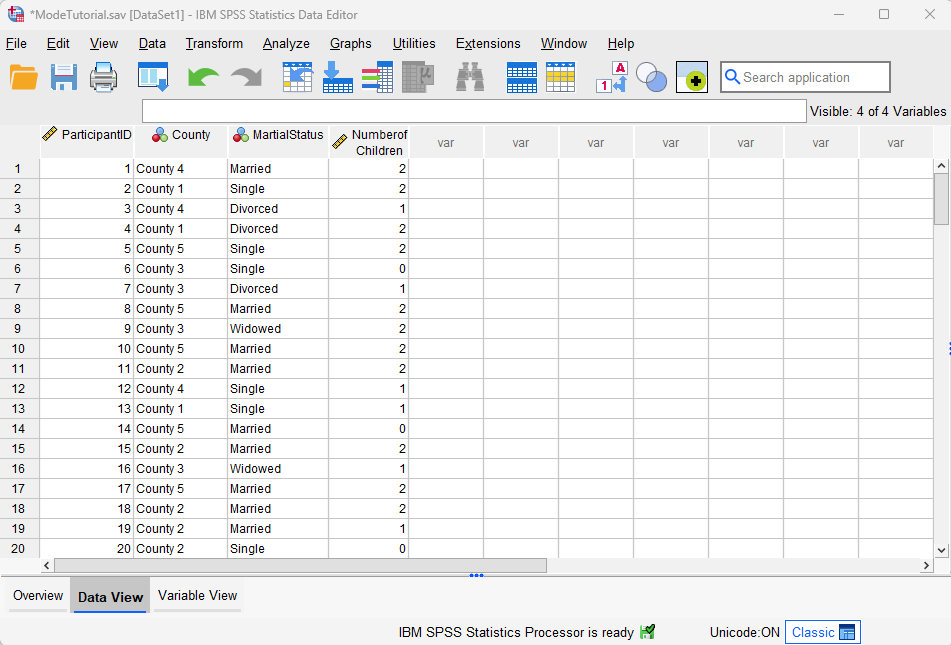
We start from the assumption that you you have already imported your data into SPSS. Our data set for this tutorial contains the county, marital status and number of children for 100 fictitious participants. The first 20 records are illustrated below.
Finding the Mode
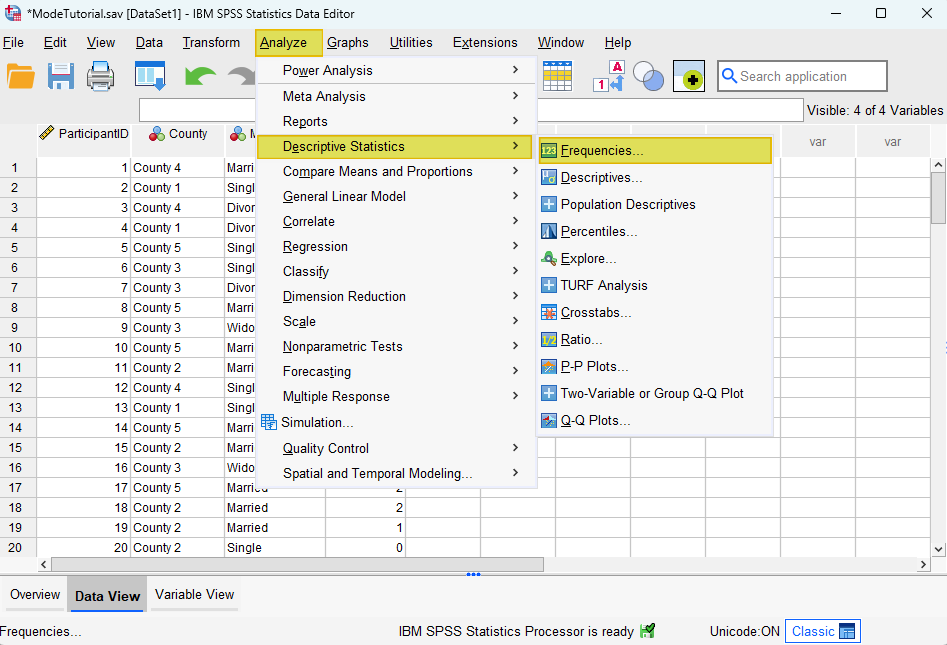
To find the mode(s) for one or more variables in in SPSS, click Analyze -> Descriptive Statistics -> Frequencies as illustrated below.
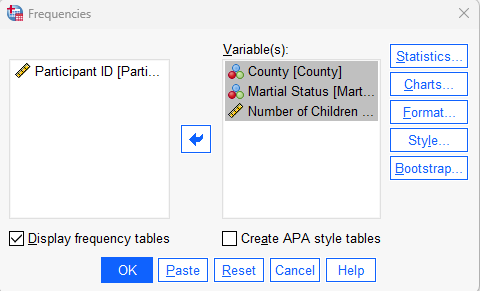
This brings up the Frequencies dialog box below. We recommend that you click the Reset button to clear any previous settings.
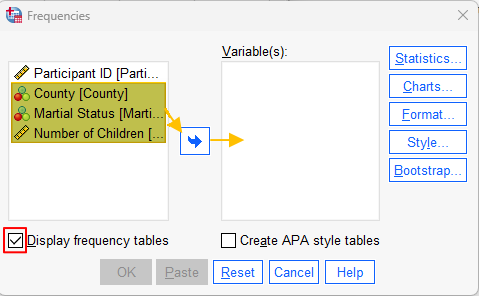
Then, holding down the Ctrl key on your keyboard, select the variable(s) for which you wish to find the mode(s), and use the arrow button to move them to Variable(s) box as per the screenshot above. Note that SPSS can calculate the mode for multiple variables in your data set at the same time, so you can select as many variables from your data set as you wish.
Next, ensure that the Display frequency tables box is checked.
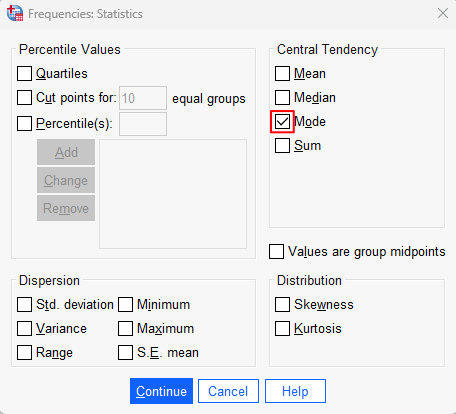
Click on the Statistics button. This brings up the Frequencies: Statistics dialog box. Place a check in the Mode check box as illustrated below.
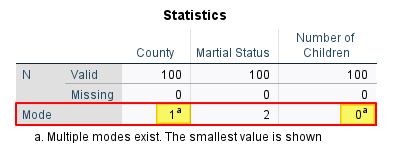
Click Continue to return to the Frequencies dialog box. It should look something like the screenshot below. That is, the variables for which you wish to find the mode(s) should be in the Variable(s) box on the right.
Click OK.
Results
The SPSS Output Viewer will pop up with your results.
The Statistics table presents a mode for each of the variables that you selected, but we need to interpret these with care.
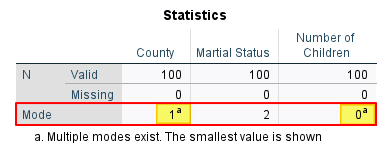
The first thing to note is that SPSS presents modes as data values, rather than the data labels in this table. So, for example, the mode for County is listed as 1 (the value) rather than County 1 (the label).
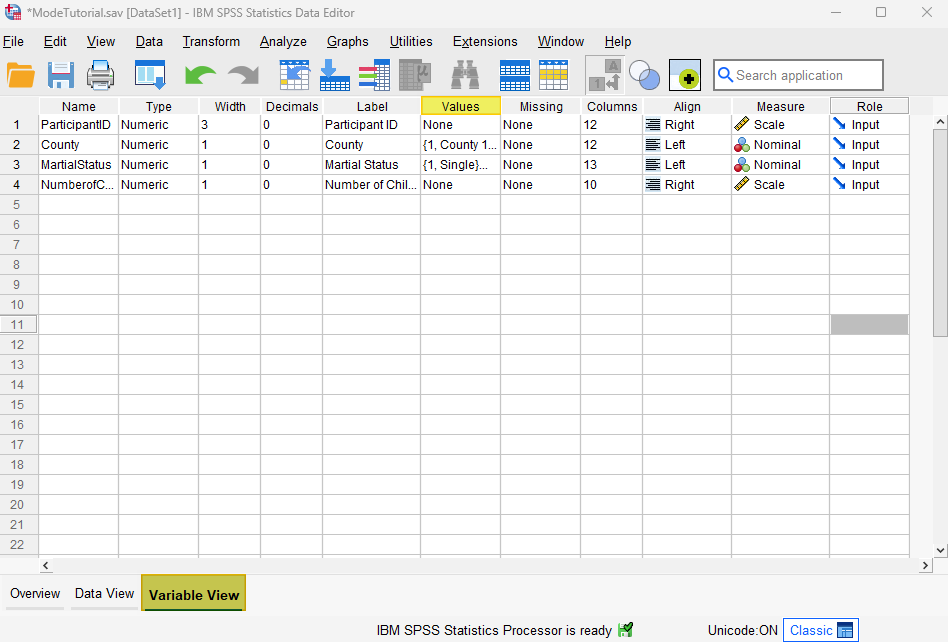
This means that, if you have coded your nominal variables using numeric values, you may need to return to the Data Editor window to check the labels for these values in the Values column of the Variable View.
The second thing to note is that, if your variable has more than one mode, SPSS will only present one value (the smallest one) in the Statistics table. The values for these multimodal and bimodal variables (“County” and “Number of Children” in our example) are followed by the letter a. For example, the mode for “County” is listed as 1a. This tells us that County 1 (value 1) is the smallest modal value of two plus modes for the variable “County.”
To find the other mode (s) for this variable, we need to review the Frequency Table. Since we know that County 1 is one of the modes, we check the frequency for County 1 (23) and look through the table to find the other value(s) with the same frequency. We can see that County 1, County 3, and County 5 all have a frequency of 23, meaning that this variable has three modes.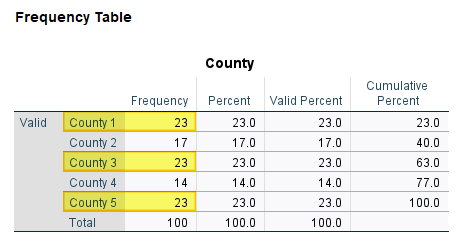
Similarly, a review of the “Number of Children” Frequency Table tells us that this variable is bimodal because an equal number of participants (33) have 0 children and 2 children.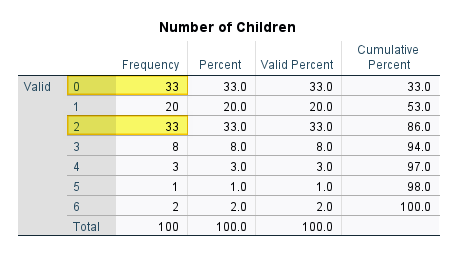
We don’t need to check the “Marital Status” Frequency Table since we know from the Statistics table that this variable has only one mode – “married” (value 2).
***************
That’s it for this tutorial. You should now be able to find the mode for one or more variables in SPSS.
***************