In this tutorial, we show you how to report a paired samples t-test from SPSS in APA style.
First, we provide a template that you can use to a report paired samples t-test in APA style. Next, we show you how to use the SPSS output from your own t-test to populate this template. Finally, we show you an example of a paired samples t-test report written using our template.
Please refer to the APA Style website for more general information about formatting reports in APA style.
Template for Reporting Paired Samples t-Tests in APA Style
A template for reporting paired samples t-tests is below. Replace the [blue bold text in square brackets] with information from your own t-test. The (red numbers in parentheses) correspond to numbers on the screenshots of SPSS output and/or to our notes and tips for writing your report (see below).
Note: The steps in this tutorial assume that you conducted a “two-tailed” test. In other words, we assume that you conducted a paired samples t-test to evaluate whether the dependent variable differed in any direction between the two groups/conditions that you compared.
The Template
A paired samples t-test was performed to evaluate whether there was a difference between the [dependent variable] [indent variable (IV) group/condition 1] and [IV group/condition 2].
The results indicated that (1) there was no significant difference between the [dependent variable] [IV group/condition 1] (M = [mean for IV group/condition 1 (2)], SD = [standard deviation for IV group/condition 1 (3)]) and [IV group/condition 2] (M = [mean for IV group/condition 2 (4)], SD = [standard deviation for IV group/condition 2 (5)]) OR the [dependent variable scores] [IV group/condition 2] (M = [mean for IV group/condition 2 (4)], SD = [standard deviation for IV group/condition 2 (5)]) was significantly higher/lower (6) than [IV group/condition 1] (M = [mean for IV group/condition 1 (2)], SD = [standard deviation for IV group/condition 1 (3)]), t([df (7)]) = [value of t (8)], p = [value of p (9)].
Using SPSS Output to Populate the Paired Samples t-Test APA Template
The screenshots below come from the SPSS output for a paired samples t-test that we performed on a fictitious data set to evaluate whether a new treatment for asthma increased the peak expiratory flow (PEF) of asthma patients. The PEF of a group of asthma patients was measured before and after they received the new treatment. The numbers on the screenshots match numbers in the APA template above. Use the corresponding values from the SPSS output for your own test to populate the template.
Note that the APA Style Guide tells us that: (a) the first line of each paragraph should be indented 0.5 inches from the left margin; and (b) the text should be double-spaced.
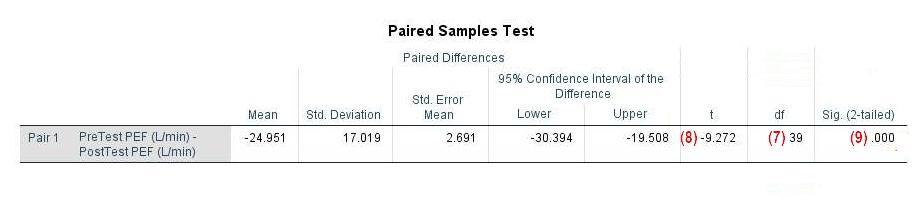
(1) Use the text highlighted in yellow if there was no significant difference in the dependent variable (PEF in our example) between the two groups/conditions in your study (patients before and after treatment in our example) Use the text highlighted in gold if there was a significant difference in the dependent variable between the groups/conditions. The difference is significant if the p value in the “Sig. (2-tailed)” column of the “Paired Samples Test” table ((9) in the screenshot below) is less than or equal to the alpha level you selected for your test. Selecting an alpha level of .05 for a test is typical.
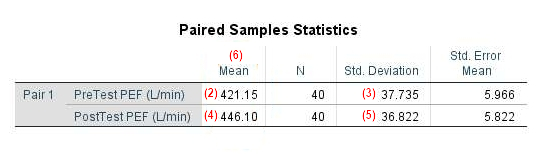
(2), (4) Report the mean for each of the two groups/conditions to two decimal places.
(3), (5) Report the standard deviation for each of the two groups/conditions to two decimal places.
(6) Check the “Mean” column of the “Paired Samples Statistics” table to see which of the two groups/ conditions has the highest (or lowest) mean score on the dependent variable. In our example, we can see that the mean PEF in the post-test condition (after patients received the new treatment) is higher than the mean PEF in the pre-test condition (before they received the treatment). Use an appropriate adjective to compare the two groups/conditions in your study, e.g., higher, lower, greater, smaller, etc.
(7) Report the degrees of freedom (df) as per the “Paired Samples Test” table in your SPSS output.
(8) Report the value of t as per the “Paired Samples Test” table to two decimal places. If your t value is smaller than +1.00/-1.00, add a leading zero (e.g., report 0.79 rather than .79). If your t value is negative, you can choose to report it as a positive value. So, in our example, we report 9.27 rather than -9.27.
(9) Report the p value to two or three decimal places as per the “Sig. (2-tailed)” column of the “Paired Samples Test” table. If the p value is .000 however (as it is in our example), report it as < .001. You should not add a leading zero to your p value.
We encourage you to tweak the wording of our template if doing so allows you to communicate your results in a clearer way.
Example of a Paired Samples t-Test Report in APA Style
A paired samples t-test was performed to evaluate whether there was a difference between the [peak expiratory flow (PEF) of asthma patients (measured in litres per minute)] [before] and [after they received the new treatment].
The results indicated that the [PEF of asthma patients] [after they received the new treatment] (M = [446.10], SD = [36.82]) was significantly higher than [before they received the new treatment] (M = [421.15], SD = [37.74]), t([39]) = [9.27], p = [< .001].
**************
That’s it for this tutorial. You should now be able to report the results of a paired samples t-test from SPSS in APA style.
***************