This tutorial will show you how to calculate and interpret z scores in the SPSS statistical package.
Z scores are variables that have been standardized such that they have a mean of 0 and a standard deviation of 1.
Quick Steps
- Click Analyze -> Descriptive Statistics -> Descriptives
- Click “Reset” (recommended)
- Selected the variable(s) that you wish to convert to z scores, and move them to the “Variable(s)” box
- Select the “Save standardized values as variables” option
- Click “OK”
- Minimize your Output Window
- Click File -> Save
The Data
As usual with these quick tutorials, the starting assumption is that you have already imported data into SPSS, and that you’re looking at something like the data set below. (Check out our tutorials on importing data from Excel or MySQL into SPSS).
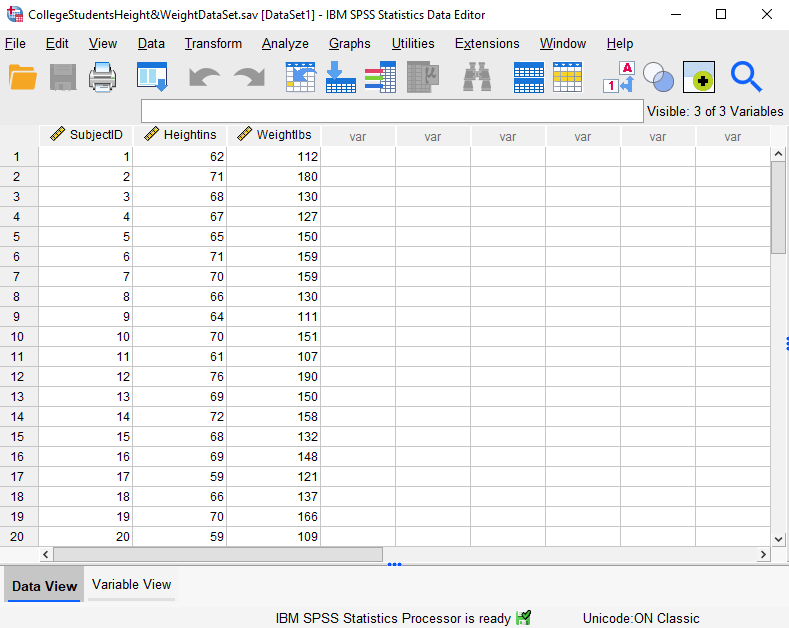
This data set records the heights (in inches) and weights (in pounds) of a hypothetical sample of 40 college students (the first 20 records are displayed above).
Calculate Z Scores
To calculate z scores for your variables, click Analyze -> Descriptive Statistics -> Descriptives as illustrated below:
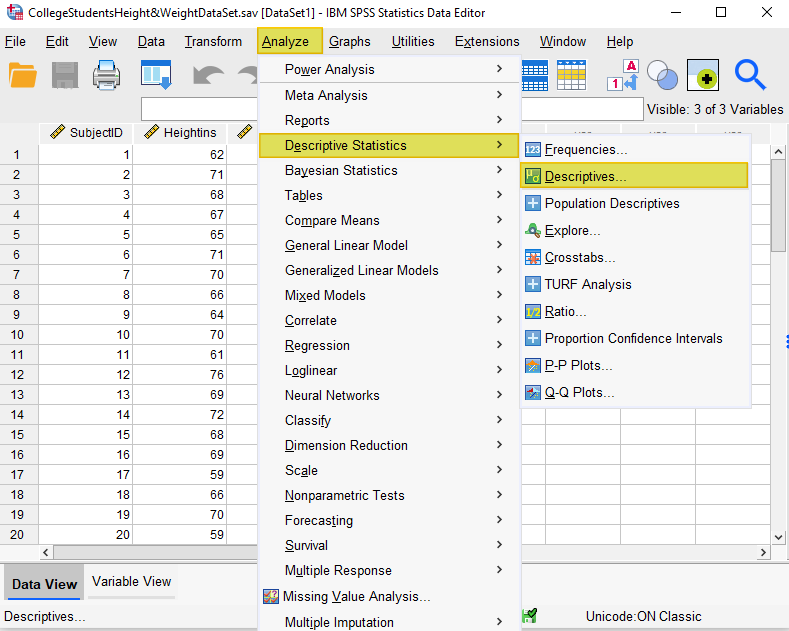
This brings up the “Descriptives” dialog box below:
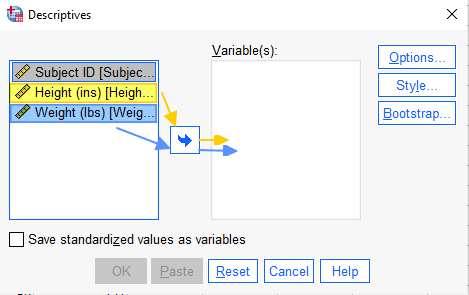
It is a good idea to select the “Reset” button to clear any previous settings.
Select the variable(s) for which you wish to calculate z scores, and use the arrow button to add them to the “Variable(s)” box.
Select the “Save standardized values as variables” check box. Your “Descriptives” dialog box should now look something like this:
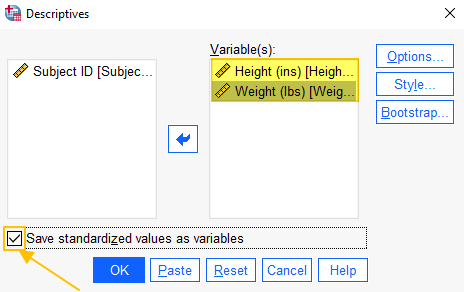 Click “OK.”
The Z Scores
The SPSS Output Viewer will pop up with a table of descriptive statistics for the variables that you have converted to z scores. (We will refer to these statistics when we interpret our z scores at the end of this tutorial).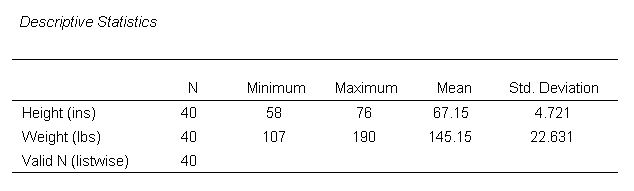
Minimize the Output Viewer to return to the data window.
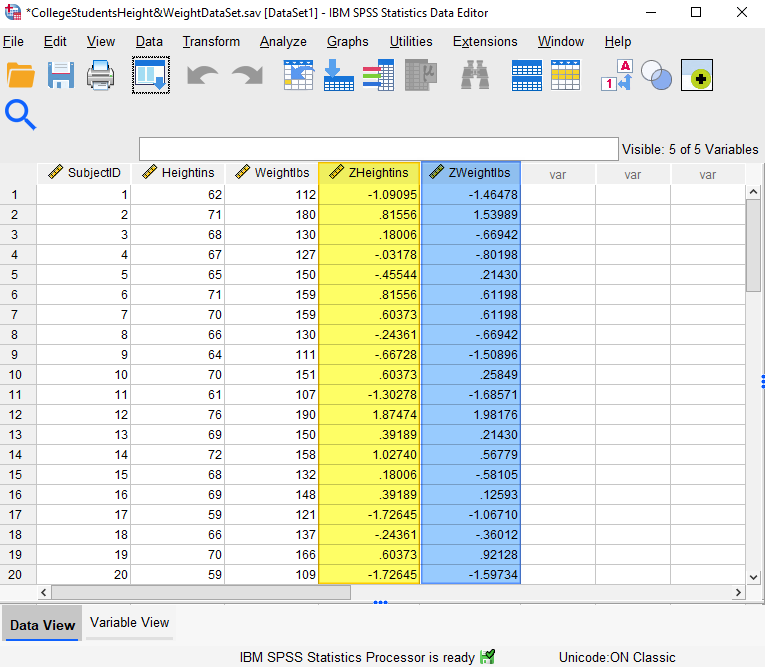
Note that, in addition to your original variables, SPSS has added z score variables to your data file (highlighted in the screenshot above). The name of these new variables (the z scores) is Z followed by the original variable name (in our example data set, the z scores for Heightins have a variable name of ZHeightins, and the z scores for Weightlbs have a variable name of ZWeightlbs).
Be sure to click File -> Save to save your date set with the z scores that you have added.
Interpreting the Z Scores
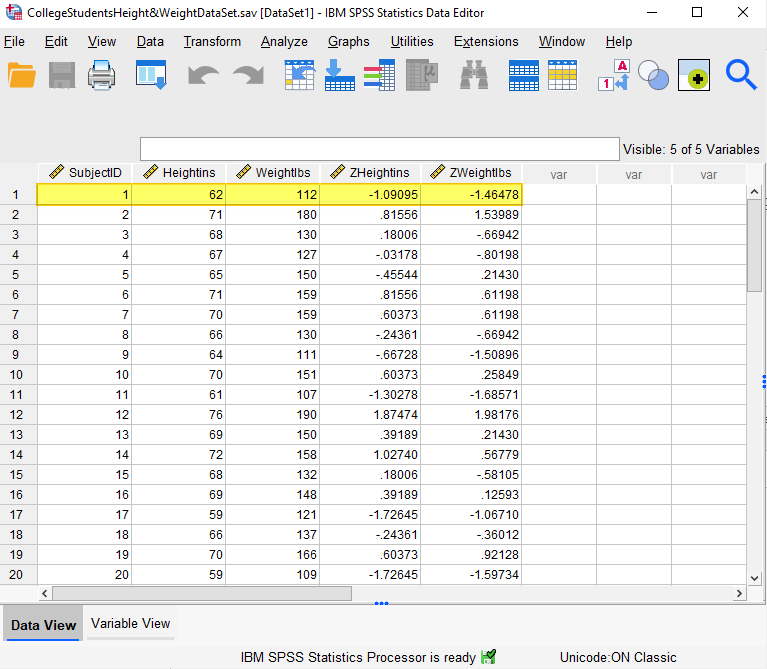
The z scores are standardized scores that tell us the distance and direction of each observation (for height and weight in this example) from the mean for that variable. Z scores with a minus sign represent observations that are below the mean for the sample, while positive z scores represent observations that are above the mean. So, for subject 1 (highlighted in the screenshot below), the z score for height (-1.09095) tells us that the subject’s height is 1.09095 standard deviations below the sample mean for height.
We can demonstrate this by using the z score, and the mean and the standard deviation for the sample, to calculate the original height observation for subject 1 as follows: Original observation = mean + (z score)(standard deviation).
As illustrated in the “Descriptive Statistics” screenshot, the mean height for this sample is 67.15 and the standard deviation is 4.721. Using the formula above to calculate the original observation for the height of subject 1, we have: original observation = 67.15 + (-1.09095)(4.721) = 61.99963. 61.99963 rounds up to 62 inches – the original height observation recorded for subject 1.
***************
That’s it for this quick tutorial. You should now be able to calculate and interpret z scores in SPSS.
***************