This tutorial will show you how to create a stem and leaf plot in the SPSS statistical package.
Quick Steps
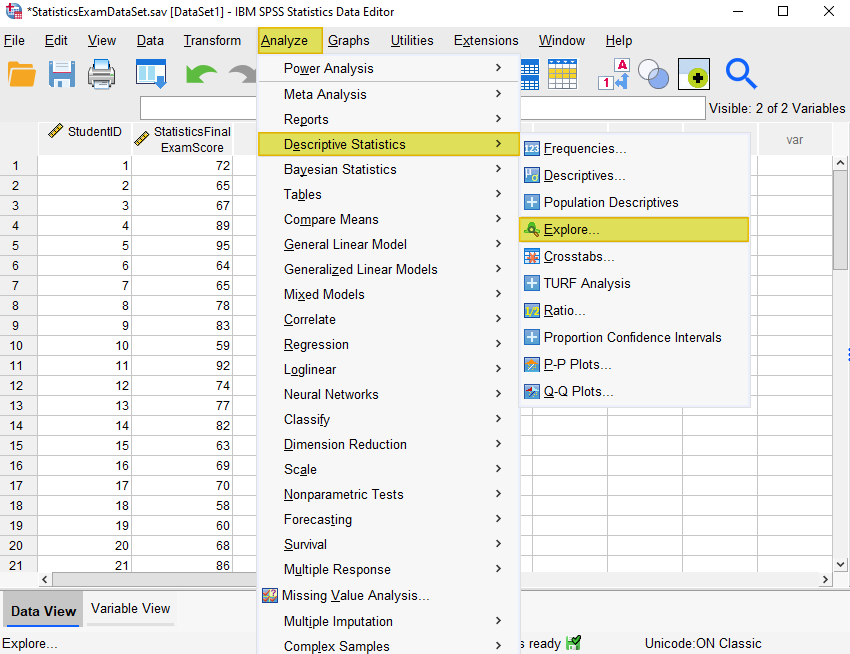
- Click Analyze -> Descriptive Statistics -> Explore
- Click “Reset” (recommended)
- Move the variable you wish to plot into the “Dependent List” box
- Click the “Plots” button
- Ensure the “Stem-and-leaf” option is selected under “Descriptive”
- Under “Boxplots” select “None” for “Boxplots”
- Click “Continue”
- Under “Display” select “Plots”
- Click “OK”
The Data
As usual with these quick tutorials, the starting assumption is that you have already imported data into SPSS, and you’re looking at something like the data set below. (Check out our tutorials on importing data from Excel or MySQL into SPSS).
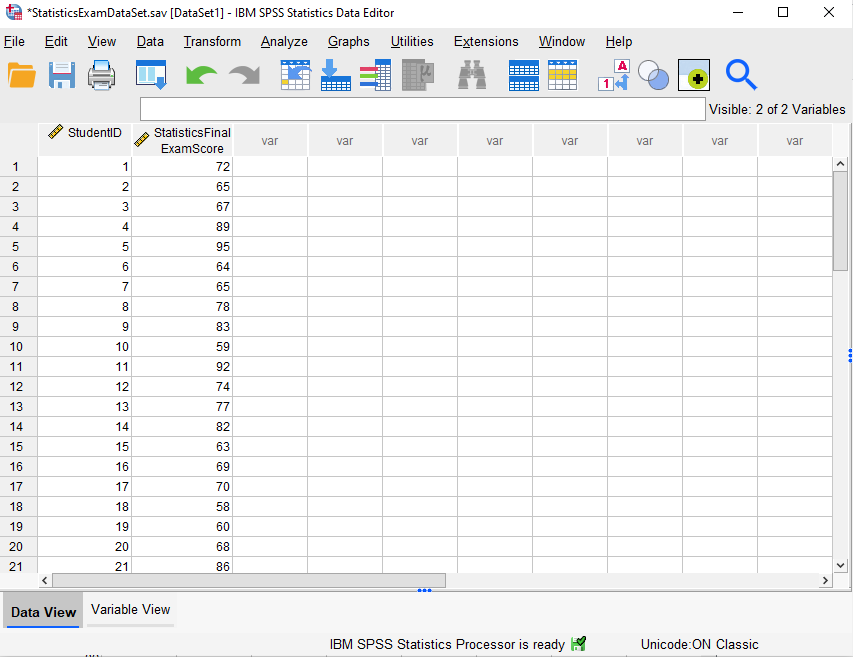
This data set contains the hypothetical final exam scores of 40 students in a Statistics course (first 21 records displayed). We want to create a stem and leaf plot of these scores. Doing this will allow us to visualize the distribution of the scores while preserving information about the individual scores.
Create a Stem and Leaf Plot
Select Analyze -> Descriptive Statistics -> Explore as illustrated below:
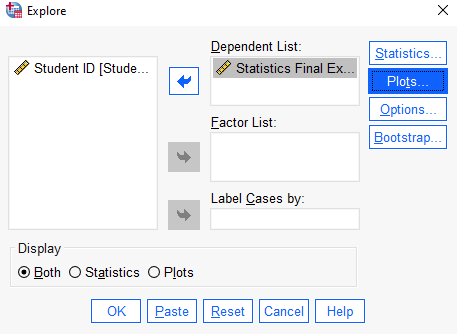
This brings up the “Explore” dialog box illustrated below:
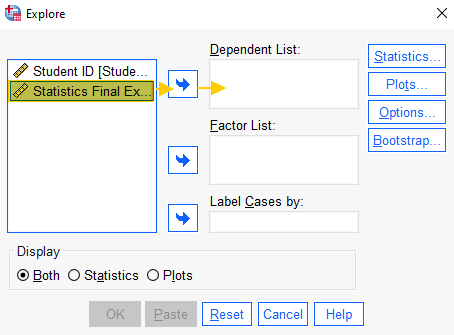
It is a good idea to click the “Reset” button to clear any previous settings.
Select the variable for which you wish to create a stem and leaf plot (“Statistics Final Exam Score” in this example), then use the arrow button to move it into the “Dependent List” box (as illustrated above). Then, click the “Plots” button. This will bring up the “Explorer: Plots” dialog box illustrated below:
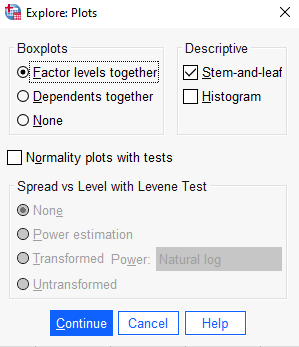
Make sure that the “Stem-and-leaf” option is selected under “Descriptive.” Then select “None” under “Boxplots” and click the “Continue” button to return to the “Explore” dialog box below.
Under “Display,” select “Plots” if you only want to generate a stem and leaf plot (without any accompanying statistics). Then click the “OK” button.
The Stem and Leaf Plot
The SPSS Output Viewer will pop up with the stem and leaf plot that you’ve created.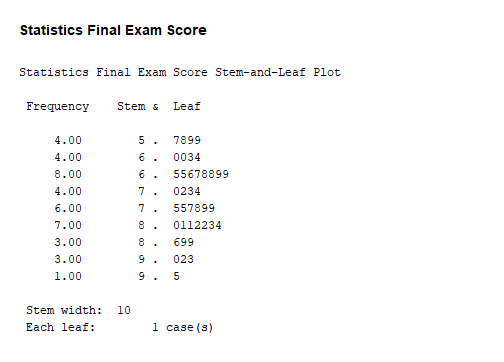
Note that SPSS displays the “stem width” together with the number of cases that each leaf represents. In this example, the stem width of 10 means that the 5 in the stem column represents 50 (that is, 5 multiplied by 10), 6 represents 60 (6 multiplied by 10), and so on. Since each leaf represents 1 case, we know that 7899 in the leaf column after the stem of 5 represents final exam scores of 57, 58, 59 and 59.
If you want to save your stem and leaf plot, you can right-click on it within the Output Viewer in SPSS, and copy it to use in other programs. Alternatively, check out our tutorial on exporting SPSS output to other applications such as Word, Excel, or PDF.
***************
That’s it for this quick tutorial. You should now be able to create a stem and leaf plot within SPSS.
***************