In this tutorial we show you how to report a Pearson correlation coefficient calculated in SPSS in APA style. For additional information about formatting your reports, please refer to the APA Style website.
First, we provide two templates that you can use to report your Pearson correlation coefficients in APA style. Then we show you how to populate these templates using your own SPSS output. Finally, we show you two examples of Pearson correlation coefficient reports, one written using each of our APA style templates.
Templates for Reporting a Pearson Correlation Coefficient in APA Style
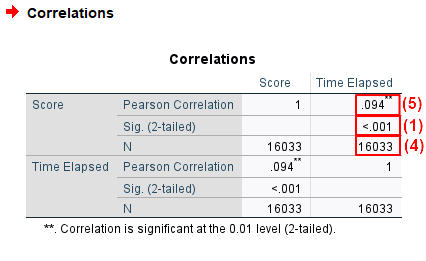
Two templates for reporting your Pearson correlation coefficients are below. Use the first template if the relationship between your two variables is significant. The relationship is significant if the p value in the “Sig. (2-tailed)” rows of the Correlations table in the SPSS output (see (1) in the screenshot below) is less than or equal to the alpha level you selected for your test. An alpha level of .05 is typical.
Use the second template if the relationship between your two variables is not significant. The relationship is not significant if the p value in the “Sig. (2-tailed)” rows of the Correlations table is greater than the alpha level you selected for your test.
Replace the [blue bold text in square brackets] in these templates with information from your own Pearson correlation coefficient. The (red numbers in parentheses) correspond to numbers on the screenshot of SPSS output below and/or our notes and tips for writing your report (also below).
Template for Reporting a Pearson Correlation Coefficient When the Relationship Between Variables is Significant
A Pearson correlation coefficient was calculated to evaluate the relationship between [variable 1] and [variable 2]. There was a significant [strength of relationship] (2) [direction of relationship] (3) relationship between [variable 1] and [variable 2], r([N(4)-2]) = [Pearson correlation] (5), p = [value of p] (1).
Template for Reporting a Pearson Correlation Coefficient When the Relationship Between Variables is Not Significant
A Pearson correlation coefficient was calculated to evaluate the relationship between [variable 1] and [variable 2]. The results indicated that the relationship between [variable 1] and [variable 2] was not significant, r([N(4)-2]) = [Pearson correlation] (5), p = [value of p] (1).
Populating the Pearson Correlation Coefficient APA Template with Values from Your SPSS Output
The numbers on the screenshot of SPSS output below correspond to numbers in the APA templates above. Use the values from your own SPSS output to populate the appropriate template.
Selected SPSS Output
The screenshot below is from a Pearson correlation coefficient that we calculated in SPSS to evaluate the relationship between the number of questions that people answered correctly in a logic test and the amount of time in seconds that it took them to complete the test.
Notes and Tips for Writing your Pearson Correlation Coefficient Report in APA Style
The APA Style Guide states: (a) that the first line of each paragraph should be indented 0.5 inches from the left margin; and (b) that the text should be double-spaced.
(1) Report the exact p value to two or three decimal places as per the SPSS output. However, if the p value is .000, report it as < .001. Do not add a leading zero to your p value. (Note, for example, that we have used < .001 rather than < 0.001 to report the p value in the first example below).
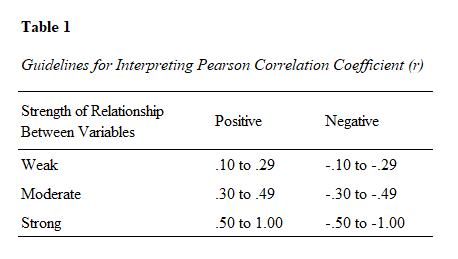
(2) and (3): General guidelines for interpreting the strength (2) and direction (3) of the relationship between the two variables are presented in Table 1 below, but it should be noted that several other guidelines also exist. In our example, the value of the Pearson Correlation is .094 (which we round to .09). Since this is slightly below the weak positive range (.10 to .29), we may say that there is a very weak positive relationship between our two variables (the number of questions that people answered correctly in a logic test and the amount of time in seconds it took them to complete the test).
(4) The value in the parentheses after r is N-2, the degrees of freedom (df) for the Pearson correlation coefficient. In our example, N = 16,033 so the df is 16,031.
(5) Report the Pearson Correlation (the value of r) to two decimal places. Do not add a leading zero to this value. (Note, for example, that we have used .09 and -.08 rather than 0.09 and -0.08 in the examples below).
Examples of Pearson Correlation Coefficient Reports Written in APA Style
A Pearson Correlation Coefficient With a Significant Relationship Between Variables
A Pearson correlation coefficient was calculated to evaluate the relationship between [the number of questions that people answered correctly in a logic test] and [the amount of time in seconds that it took them to complete the test]. There was a significant but [very weak] [positive] relationship between [the number of questions that people answered correctly] and [the amount of time in seconds that it took them to complete the test], r([16,031]) = [.09], p = [< .001].
A Pearson Correlation Coefficient With No Significant Relationship Between Variables
A Pearson correlation coefficient was calculated to evaluate the relationship between [the distance that a person can throw a frisbee (in meters)] and [their score in an a Chemistry exam]. The results indicated that the relationship between [the distance that a person can throw a frisbee] and [their score in a Chemistry exam] was not significant, r([38]) = [-.08], p = [.15].
***************
That’s it for this tutorial. You should now be able to report the results of a Pearson correlation coefficient calculated in SPSS in APA style.
***************