This quick tutorial is designed to show how to do a paired samples t test in SPSS and how to interpret the result.
A paired samples t test, also known as a dependent samples t test, will sometimes be performed in the context of a pretest-posttest experimental design. For this tutorial, we’re going to use data from a hypothetical study looking at the effect of a new treatment for asthma by measuring the peak flow of a group of asthma patients before and after treatment.
Quick Steps
- Analyze -> Compare Means -> Paired-Samples T Test
- Drag and drop the first of the paired variables into the Variable 1 box on the right, and the second into the Variable 2 box
- Click OK to run the test
- The result will appear in the SPSS output viewer
The Data
This is our hypothetical data as it appears in the SPSS Data View.
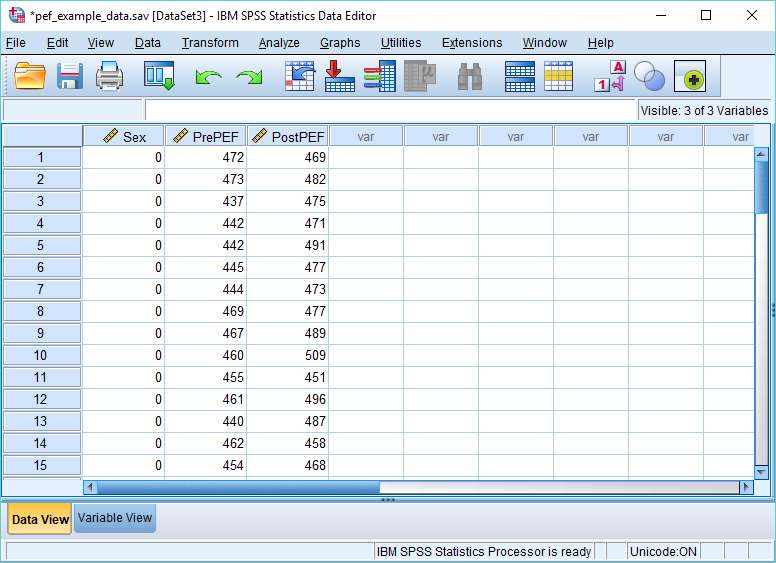
As you can see, there are three variables. Sex – Male or Female. PrePEF – pretest peak expiratory flow (measured in litres per minute). PostPEF – posttest peak expiratory flow (measured in litres per minute).
It’s a paired subjects design, with a repeated measure being taken for each subject.
We want to find out if there is a difference between the mean pretest PEF and mean posttest PEF, and if so whether it is statistically significant. The paired samples t test is appropriate for this task.
Paired Samples T Test
To begin the paired samples t test, click on Analyze -> Compare Means -> Paired-Samples T Test. This will bring up the paired-samples t test dialog box.
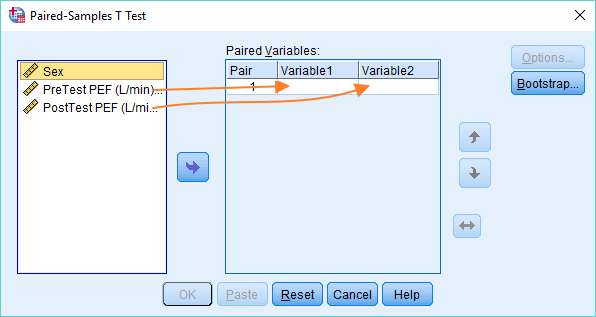
The next stage is to get the PreTest and PostTest variables over from the left box into their respective boxes on the right to create the pair of variables (as above). You can do this by dragging and dropping, or by selecting and using the arrow in the middle.
You should end up with a dialog box that looks like this.
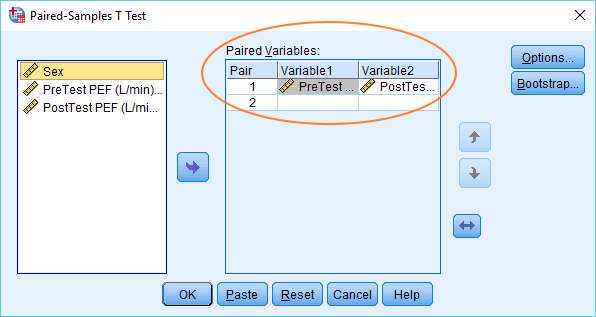
Once you’ve set the dialog box up correctly, you should hit OK to run the paired samples t test.
The Result
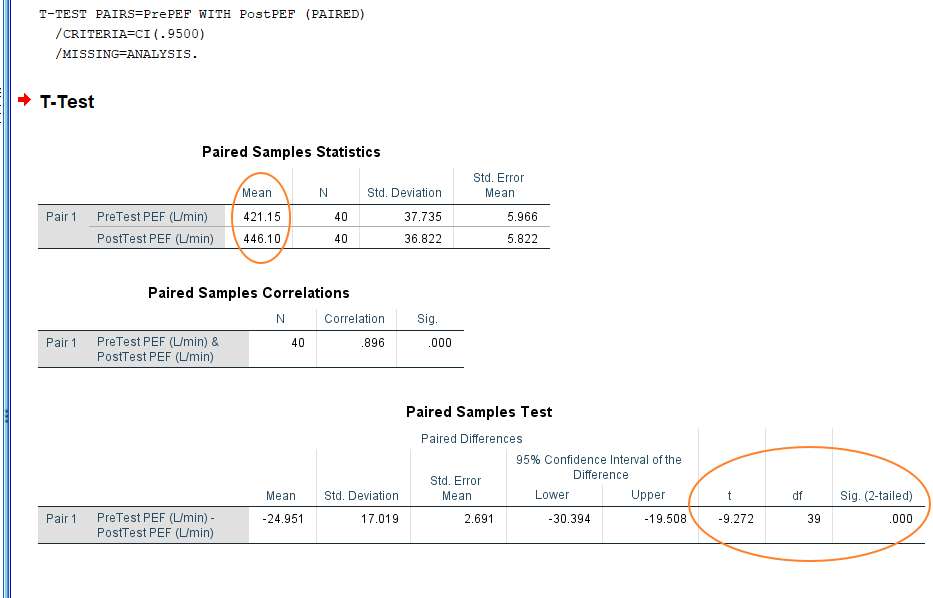
The result of the paired samples t test will pop up in the SPSS output viewer. It will look like this.
This is not as complicated as it might at first look.
The first thing to note is the difference between the means in the pretest and posttest conditions. As you can see above, the average PEF is nearly 25 L/min higher in the posttest condition. The question is whether this difference is large enough to reach statistical significance.
This is where the paired samples t test comes into play. We’ve got a t value of -9.272 (see the Paired Samples Test table), which gives us a p-value – or 2-tailed significance value – of .000. This is going to be a significant result for any plausible alpha level.
A standard alpha level is .05, and .000 is smaller than .05, so we’re able to reject the null hypothesis which asserts there is no significant difference between the PEF scores in pretest and posttest conditions. To put this another way, the difference between the means in the two conditions is extreme enough that it is very unlikely to have occurred merely due to chance, therefore, we can conclude that it is a real difference.
It should be noted, however, that if this were a real experiment, it wouldn’t be designed very well. It doesn’t have a control group. To put it simply, we don’t know how much the PEF scores would have changed in the absence of the treatment intervention, therefore, it’s very difficult to draw a conclusion about the efficacy of the treatment.
***************
Right, that’s it for this quick tutorial. You should now be able to run a paired samples t test in SPSS, and to interpret the result that you get. You may also be interested in our tutorials on: (1) exporting the SPSS output for your test to another application such as Word, Excel, or PDF; and (2) reporting the results of a paired samples t test from SPSS in APA style.