This quick tutorial will show you how to do an independent samples t test in SPSS and how to interpret the result.
Quick Steps
- Click on Analyze -> Compare Means -> Independent-Samples T Test
- Drag and drop the dependent variable into the Test Variable(s) box, and the grouping variable into the Grouping Variable box
- Click on Define Groups, and input the values that define each of the groups that make up the grouping variable (i.e., the coded value for Group 1 and the coded value for Group 2)
- Press Continue, and then click on OK to run the test
- The result will appear in the SPSS data viewer
The Data
The standard way to organize your data within the SPSS Data View when you want to run an independent samples t test is to have a dependent variable in one column and a grouping variable in a second column.
Here’s what it might look like.
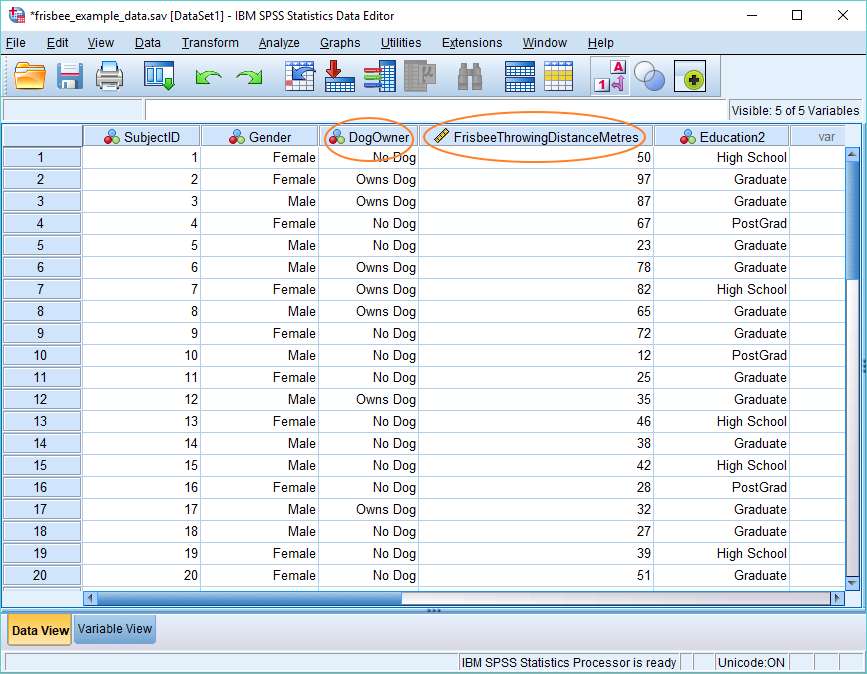
In this example, Frisbee Throwing Distance in Metres is the dependent variable, and Dog Owner is the grouping variable. Put simply, we want to know whether owning a dog (independent variable) has any effect on the ability to throw a frisbee (dependent variable).
Independent Samples T Test
To begin the calculation, click on Analyze -> Compare Means -> Independent-Samples T Test. This will bring up the following dialog box.
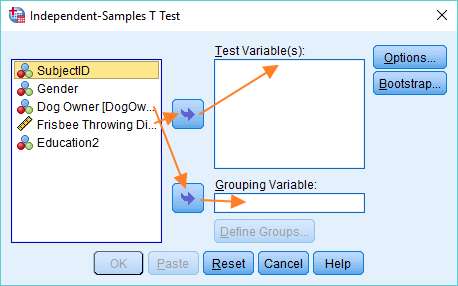
To perform the t test, we’ve got to get our dependent variable (Frisbee Throwing Distance) into the Test Variable(s) box, and our grouping variable (Dog Owner) into the Grouping Variable box. To move the variables over, you can either drag and drop, or use the arrows, as above.
The dialog box should now look like this.
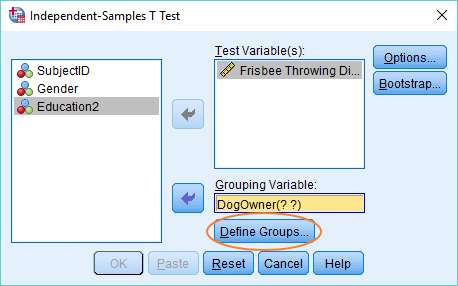
You’ll notice that the Grouping Variable, DogOwner, has two question marks in brackets after it. This indicates that you need to define the groups that make up the grouping variable. Click on the Define Groups button.
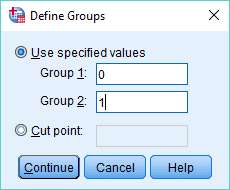
We’re using 0 and 1 to specify each group, because these values match the way the variable is coded (you’re seeing value labels in the Data View, not the underlying numeric values). 0 is No Dog; and 1 is Owns Dog.
It’s also worth noting that if you had coded your grouping variable as a String type, then you’d need to match the string values that appear in the Data View precisely – for example, “No Dog” and “Owns Dog”.
Once you have specified the values that define each group, press the Continue button, and then click on OK in the main dialog box to run the independent samples t test.
The Result
The result will pop up in the SPSS Output Viewer. It all looks a bit more complex than strictly necessary, but it’s easy enough to retrieve the information we need.
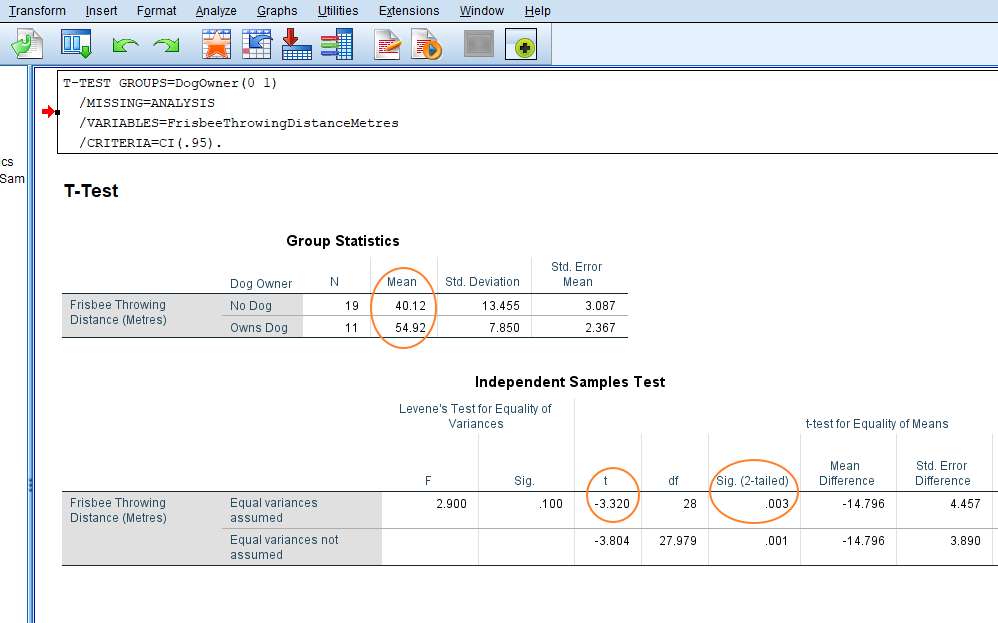
The first thing to note is the mean values in the Group Statistics table. Here you can see that on average people who own dogs throw frisbees further than people who don’t own dogs (54.92 metres as against only 40.12 metres).
The question is whether the difference between the two means is big enough so that we can be confident it’s not a function of random error. This is where the t test comes into play.
SPSS is reporting a t value of -3.320 and a 2-tailed p-value of .003. This would almost always be considered a significant result (standard alpha levels are .05 and .01). Therefore, we can be confident in rejecting the null hypothesis that holds that there is no difference between the frisbee throwing abilities of dog owners and non-owners.
There is one other result worth noting here, and that’s Levene’s Test for Equality of Variances. It’s an assumption of the independent samples t test that both samples have the same variance. Levene’s Test checks this assumption. It’s reporting an F value of 2.900 and a significance value of .100. The latter is greater than .05 – the standard alpha level. Therefore, we must accept the null hypothesis that there is no difference between the variances of the two samples. And, of course, this is the result that we need if we want to run the independent samples t test.
***************
That’s it for another SPSS quick tutorial. You should now be able to perform an independent samples t test in SPSS, and to interpret the result that you get. You may also be interested in our tutorials on: (1) exporting the SPSS output for your test to another application such as Word, Excel, or PDF; and (2) reporting your independent samples t-test in APA style.