In this tutorial, we show you how to report a Chi Square Test of Independence performed in SPSS in APA style. For additional information about formatting your reports in APA style, please refer to the APA Style website.
First, we provide a template that you can use to report your Chi Square Test of Independence in APA style. Then we show you how to populate this template using your own SPSS output. Finally, we show you an example of a report of a Chi Square test written using the template.
Template for Reporting a Chi Square Test of Independence in APA Style
A template for reporting your Chi Square Test of Independence is below. The [blue bold text in square brackets] needs to be replaced with information from your own Chi Square test. The (red numbers in parentheses) correspond to numbers on the screenshots of selected SPSS output below and/or our notes and tips for writing your report (also below).
APA Template Text
A chi-square test of independence was performed to evaluate the relationship between [variable 1] and [variable 2]. The relationship between these variables [was/was not] (1) significant, χ2 ([df] (2), N = [N] (3)) = [value of χ2] (4), p = [value of p] (5). [Category X of variable 1] were [more/less likely] to [category Y of variable 2] than were [category Y of variable 1] (6).
Populating the Chi Square APA Template With SPSS Output
The numbers in the screenshots of selected SPSS output below correspond to numbers in the APA reporting template above. Take these values from your own SPSS output and use them to populate the template.
Selected SPSS Output
The screenshots below are from a Chi Square test that we performed in SPSS to determine whether there was an association or relationship between religion and whether or not people eat meat.
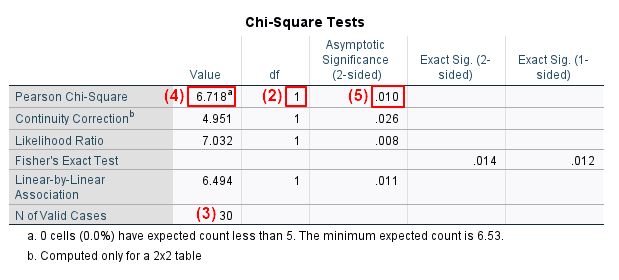
The Chi-Square Tests tables contains the values that we will need when we write our report.

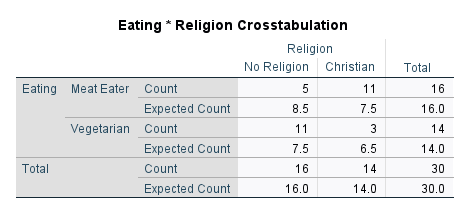
The Crosstabulation of our two variables (Eating and Religion), tells us how many cases or subjects are in each combination of our variable categories as well as how many cases would be in each of these combinations if the variables were independent of each other. We can see that:
- The count for Christian Meat Eater (11) is higher than the expected count (7.5).
- The count for No Religion Meat Eater (5) is lower than the expected count (8.5).
- The count for Christian Vegetarian (3) is lower than expected count (6.5).
- The count for No Religion Vegetarian (11) higher than the expected count (7.5)

We recommend using one of these comparisons between the count and the expected count to write a summary statement when our Chi Square test shows a significant relationship between our variables.
Notes and Tips for Writing Your Report in APA Style
The APA Style Guide states: (a) that the first line of each paragraph should be indented 0.5 inches from the left margin; and (b) that the text should be double-spaced.
(1) Your Chi Square test is significant if the p value for Pearson Chi-Square in the “Asymptotic Significance (2-sided)” column of the Chi-Square Tests table in the SPSS output is less than or equal to the alpha level you selected for your test. An alpha level of .05 is typical.
(4) Report χ2 from your SPSS output to two decimal places.
(5) Report the exact p value to two or three decimal places as per the SPSS output. However, if the p value is .000, report it as < .001. Do not add a leading zero to your p value. (Note that we have used .010 rather than 0.010 in our example).
(6) You only need this final statement (“Category X of variable 1 was …”) if the relationship between your variables is significant. As we explain below, there may be a few different ways to state this conclusion.
We encourage you to tweak the wording of your report to suit your own chi square test and to review this wording to ensure that it reads well.
Example of a Chi Square Test of Independence Report in APA Style
A chi-square test of independence was performed to evaluate the relationship between [religion] and [meat eating]. The relationship between these variables [was] significant, χ2 ([1], N = [30]) = [6.72], p = [.010]. [Christians] were [more likely] to [eat meat] than were [those with no religion].
Note: the statement “Christians were more likely to eat meat than were those with no religion” could have been replaced with an alternative comparison from the the Crosstabulation between Eating and Religion above. For example:
[Christians] were [less likely] to be [vegetarians] than were [those with no religion].
[Those with no religion] were [more likely] to be [vegetarian] than were [Christians].
[Those with no religion] were [less likely ]to [eat meat] than were [Christians].
***************
That’s it for this tutorial. You should now be able to report a Chi Square Test of Independence performed in SPSS in APA style.
***************