This tutorial will show you how to generate random numbers in SPSS and also outline a couple of use cases for such a procedure.
The Data
As a starting point, you should at least have an ID variable populated in the Data View of SPSS.
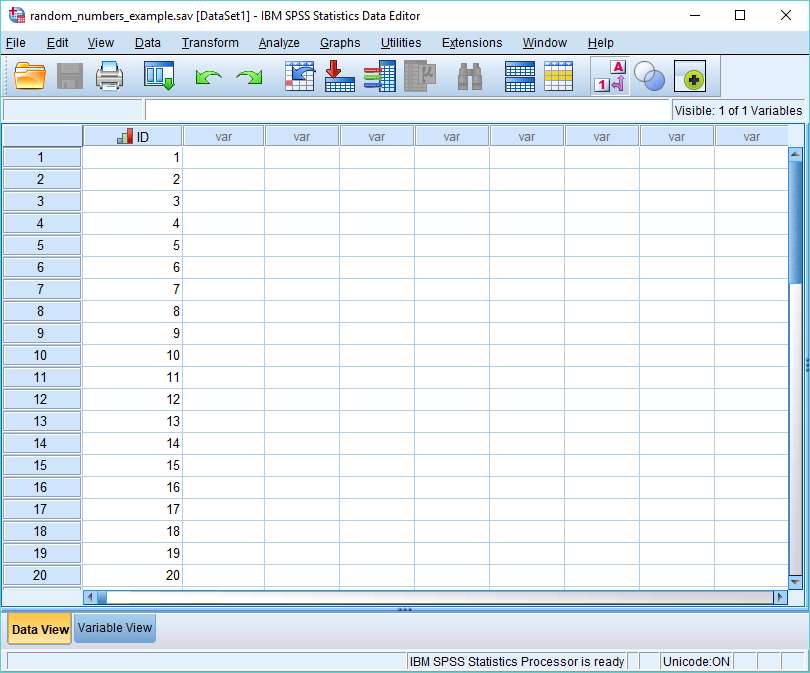
The ID variable functions to identify the number of cases in a data set for which SPSS will generate random numbers.
1. SPSS as a Random Number Generator
To generate a set of random numbers, we’re going to use SPSS’s Compute Variable dialog box.
Click on Transform -> Compute Variable.
You need to do a number of things to set up this dialog box so SPSS will generate random numbers.
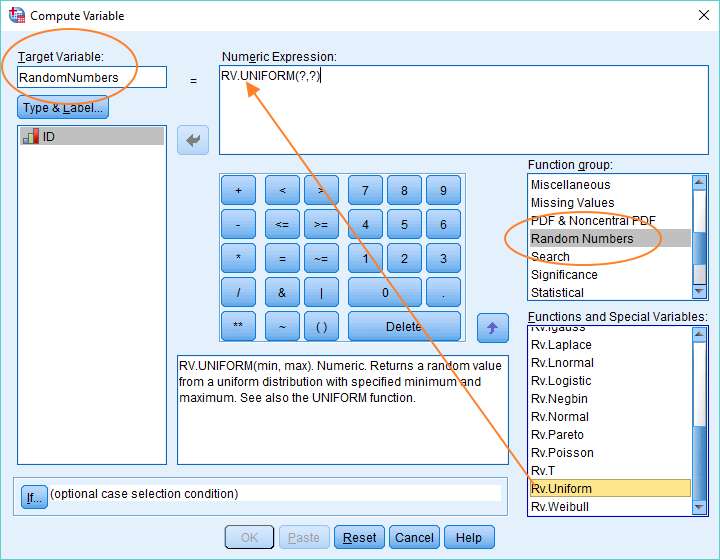
First, name your target variable. We’ve called ours RandomNumbers. This is the variable that SPSS will create to hold the set of random numbers.
Once you’ve named your target variable, select Random Numbers in the Function group on the right. This will bring up a set of functions, all of which operate to generate different kinds of random numbers.
The function we need is called Rv.Uniform. This returns a random value from a uniform distribution with a specified minimum and maximum value. Or, to put it a different way, it will generate a random number between two limits, where every possible value between the limits is equally likely to be generated.
It’s necessary to get the Rv.Uniform function into the Numeric Expression box at the top of the dialog box. You can drag and drop (as above) or use the up arrow in the middle of the dialog.
Specify a Min and Max
After you drag the RV.Uniform function into the Numeric Expression box, you’ll notice it has two question marks after it (see above). This signals that you need to specify minimum and maximum values for your random numbers.
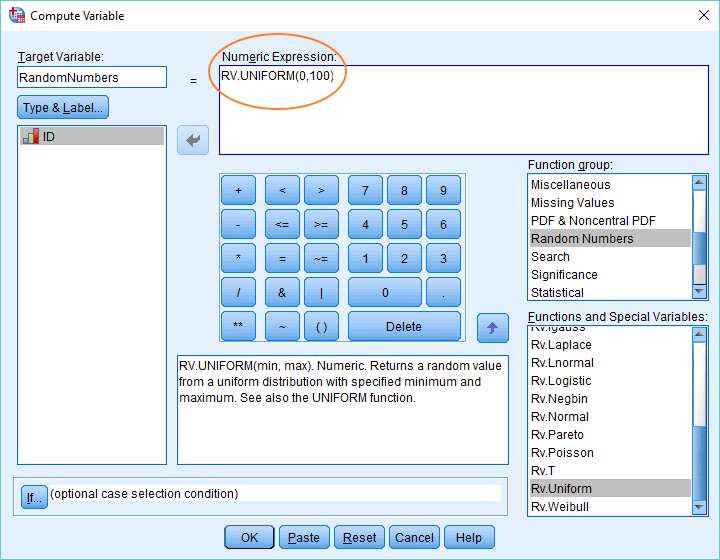
This is easy to do. Just replace each question mark with a value. We’ve chosen 0 as our minimum and 100 as our maximum (as above).
That completes the set up. Just hit OK to generate the variable containing the set of random numbers (in this case between 0 and 100).
Random Number Generator Result
As you can see below, SPSS has created a new variable called RandomNumbers, and filled it with random numbers, each with a value between 0 and 100.
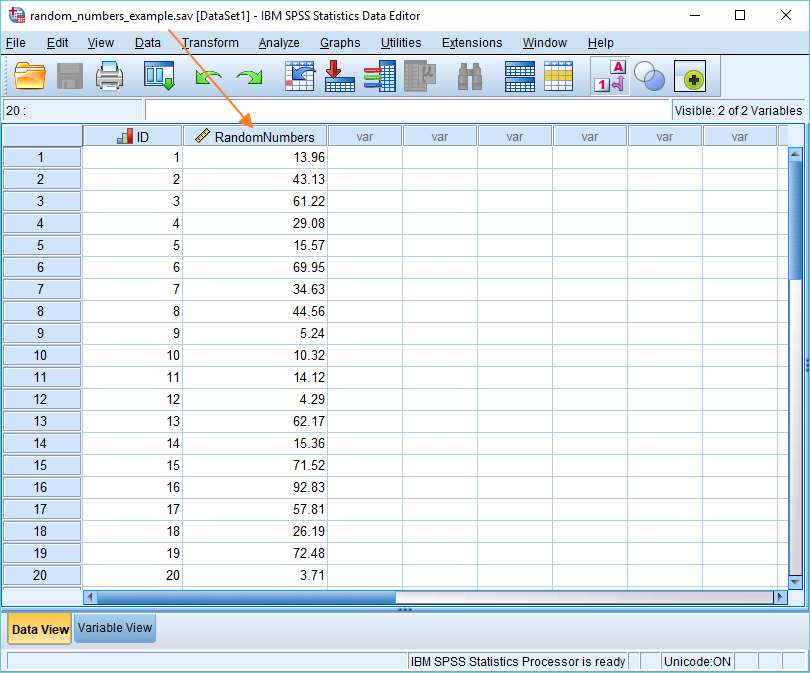
One thing to note here is that although you’re seeing only 2 decimal places, SPSS has actually calculated the numbers with much more precision (which you’ll see if you select an individual cell). This means it’s very unlikely you’ll get a duplicate number.
2. Assign People to Treatment and Control Conditions Using Random Numbers
Consider the following scenario. You’ve recruited thirty people for a medical study. You want to allocate these people to treatment and control conditions on a random basis. How do you go about it using SPSS?
The following method will work.
Fire up the Compute Variable dialog box again (Transform -> Compute Variable).
This time we’re going to combine two functions together to allocate people to a treatment and control condition (where control means getting the placebo).
The Truncate Function
As before, the first thing to do is to name our target variable. We’ve chosen TreatmentGroup as our name.
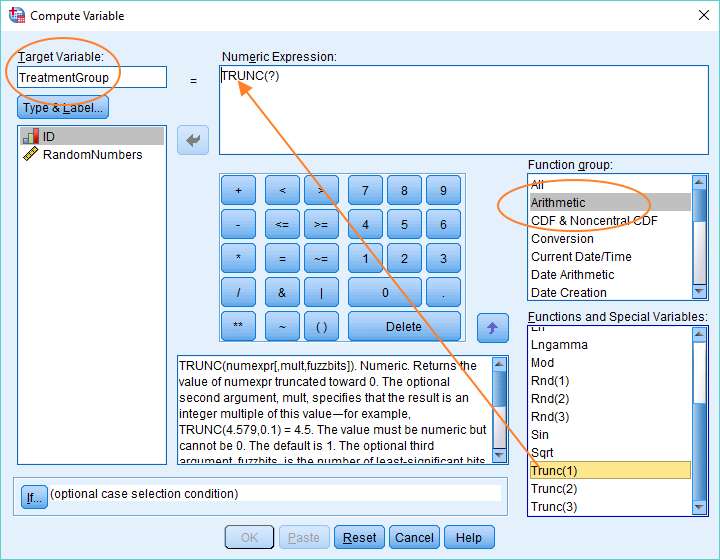
Once you’ve named your target variable, select Arithmetic in the Function group on the left, and then scroll down until you get to the Trunc(1) function.
This function has the effect of rounding any decimal number down towards zero. Or, to put this another way, it truncates a decimal so you’re left with just the integer part of the number. For example, 2.91 will become 2 and 3.33 will become 3.
As before, you’ve got to get this function up into the Numeric Expression box, which you can do by dragging and dropping.
Truncate Random Numbers between Zero and Two
You’ll have noticed there’s a question mark immediately following the Trunc function in the Numeric Expression box (see above). This is a placeholder for the value that’ll be truncated.
We’re going to truncate a random number that lies between 0 and 2. The reason why will become apparent shortly.
To do this, we’re using the same RV.Uniform function as we used before. This time let’s just type it in, but with 0 and 2 as the Min and Max values. It should replace the question mark that appears between the brackets at the end of the Trunc function in the Numeric Expression box (as below).
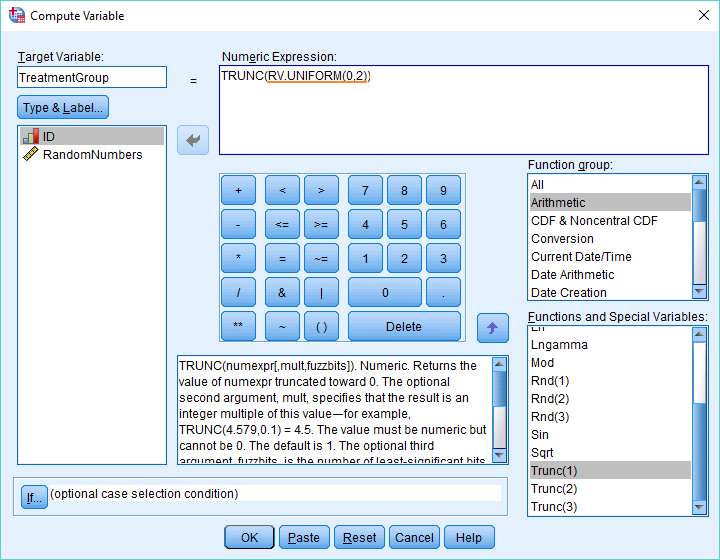
To recap, the RV.UNIFORM(0,2) function is going to create a set of random numbers between 0 and 2. The truncate function will strip away the decimal part of each number just leaving the integer part.
Let’s press OK, and see how that turns out.
Truncate Result
As you can see below, SPSS has created a new variable called TreatmentGroup, and in every case the value is either 0 or 1. (It’s theoretically possible to get a 2, but very unlikely.) This is because the truncate function has rounded every randomly generated value between 0 and 1 down to 0, and every randomly generated value between 1 and 2 down to 1.
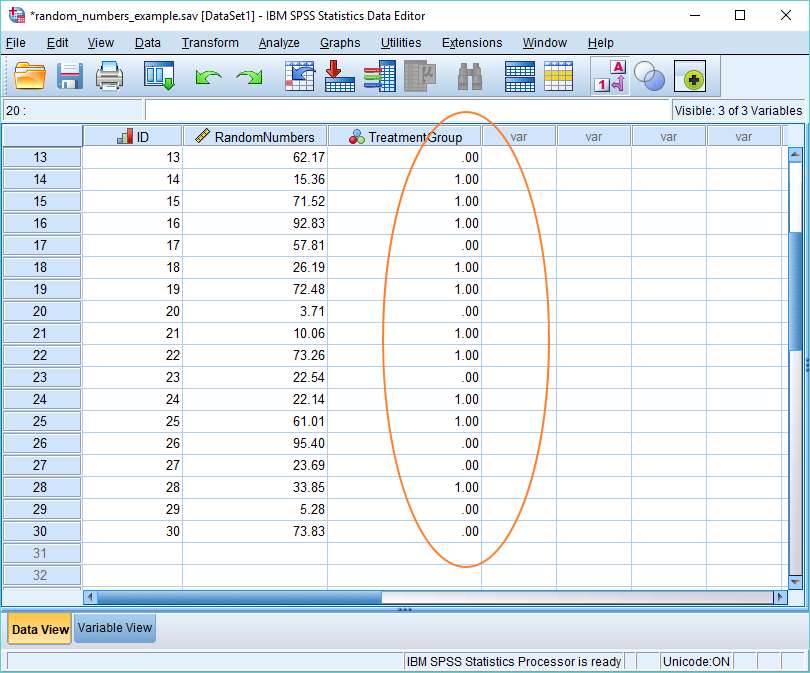
In this context, 1 means the treatment condition and 0 the control condition, so we’ve achieved our goal of randomly allocating people to treatment and control conditions. However, you might want to tidy things up a little by going into the Variable View and setting up value labels (1 = Treatment, 0 = Control).
3. Generate Random Numbers from a Normal Distribution
SPSS allows you to generate random numbers that are drawn from a normal distribution with a specified mean and standard deviation. This functionality will often be useful for various sorts of computer simulation.
Imagine you want to run a population level simulation of the effectiveness of different treatment options for a particular disease, and you know that drug efficacy is affected by patient weight. In this situation, you’re going to want your population model to reflect the distribution of weights of people in the real world. We already know weight is normally distributed, which means so long as we know the mean and standard deviation of the distribution, we can create a random distribution of weights in SPSS that will match the characteristics of the distribution of real world weights.
This is how we’d do this for adult males, assuming that the mean weight of an adult male is 195 lbs and the standard deviation of the distribution of weights is 35 lbs.
The Set Up
Navigate to the Compute Variable dialog box again (Transform -> Compute Variable). Hit reset if you need to return it to its default state. You should by now be familiar with the next several steps.
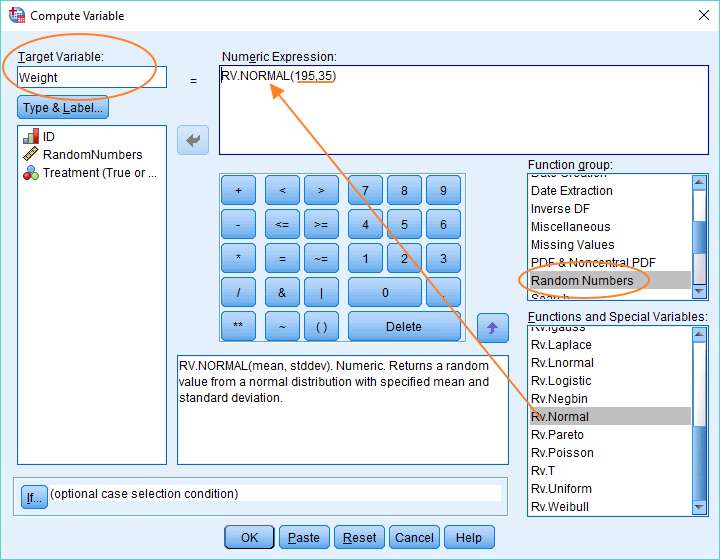
First, name your Target Variable (we’ve got Weight as our variable name).
Second, choose Random Numbers in the Function group, and within the Functions and Special Variables text box, scroll down until you get to RV.Normal.
Third, drag RV.Normal up into the Numeric Expression text box.
Fourth, replace the first question mark with 195, which is the mean weight, and the second question mark with 35, which is the standard deviation.
And that’s it. Press OK, and SPSS will create a variable called Weight, and fill it with normally distributed weights.
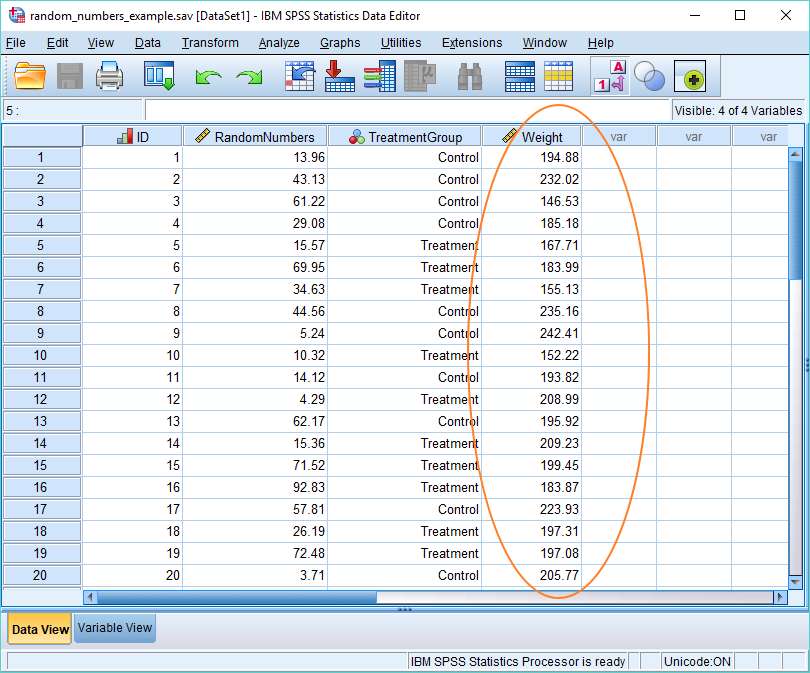
The Result
As you can see below, we now have our distribution of weights.
***************
Right, that’s it for this tutorial. You should now have an idea of how to generate random numbers within SPSS, and how you can leverage this functionality to solve various sorts of problems.