Cronbach’s alpha is used to measure the reliability – or internal consistency – of a set of scale items. It can be used, for example, to assess the internal consistency of items on a Likert scale questionnaire. In this tutorial we will show you how to calculate and interpret Cronbach’s alpha in SPSS.
Quick Steps
- Click Analyze -> Scale -> Reliability Analysis
- Click Reset (recommended)
- Move the scale items to the Items box
- Ensure that the Model option selected is Alpha
- Click the Statistics button
- Under Descriptives for, select Item, Scale, and Scale if item deleted
- Under Inter-Item, select Correlations
- Click Continue
- Click OK
Removing Scale Items to Increase Cronbach’s Alpha (if applicable)
- Click Analyze -> Scale -> Reliability Analysis
- Move the scale item that you wish to remove out of the the Items box
- Click OK
- Repeat the three steps above as needed
The Data
We start from the assumption that you have imported your data set of responses to scale items into SPSS, that you have defined your variables, and that you’re looking at something like the data set below. (Check out our tutorials on importing data from Excel and defining Likert scale variables in SPSS).
If you are working with a set of scale items that includes some items that are phrased in a “positive” way and others that are phrased in a “negative” way, it is very important to reverse score the negatively-phrased items before calculating Cronbach’s alpha.
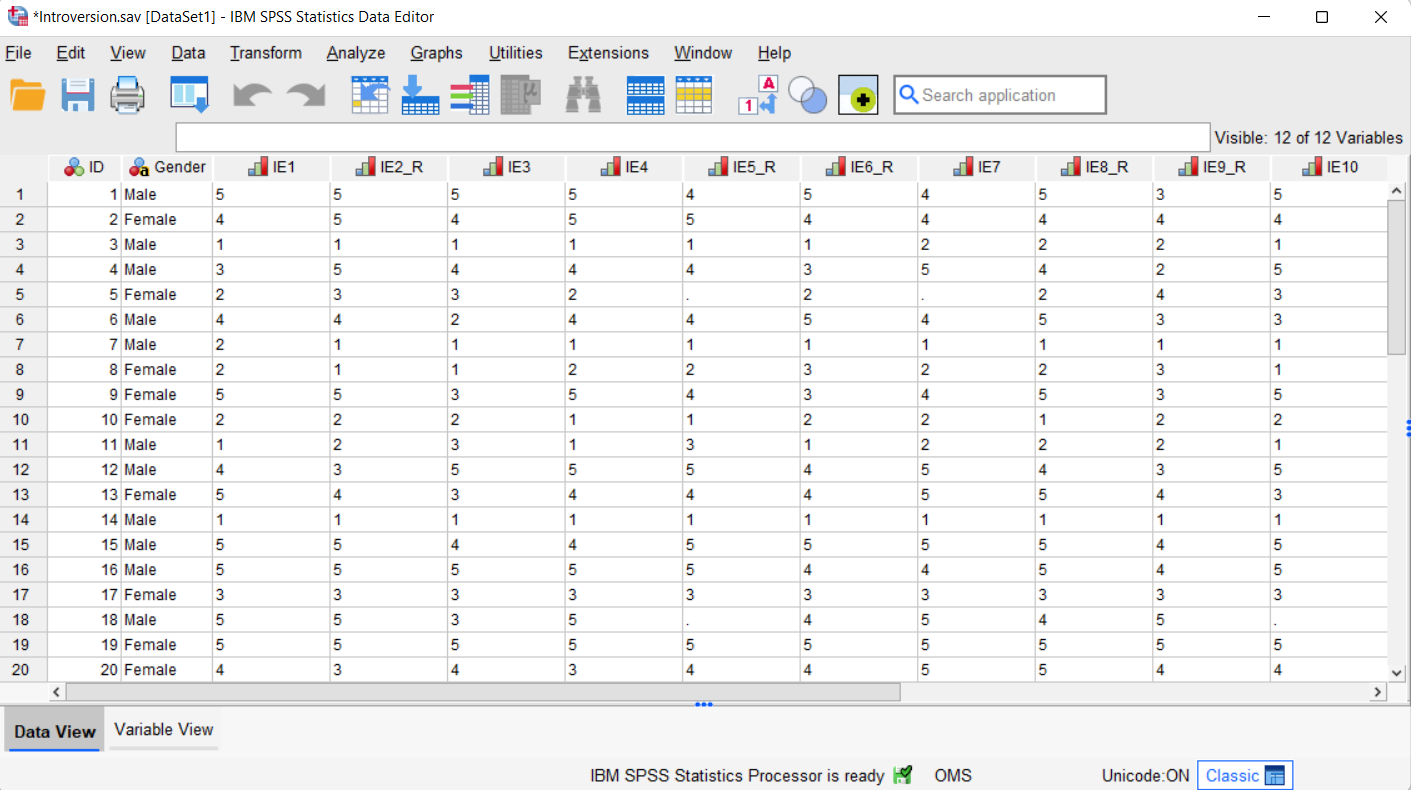
The data in our data set represents a fictitious pilot study of a 10-item Likert scale questionnaire designed to measure introversion. Participants were asked to indicate their level of agreement or disagreement with each item on a 5-point scale ranging from “strongly agree” to “strongly disagree.” Before we administer the questionnaire to a larger sample, we want to calculate Cronbach’s alpha to measure the degree of consistency between participants’ responses to the items on the questionnaire. In other words, to what extent does a particular response to one item correlate with a similar response to other items?
Calculating Cronbach’s Alpha
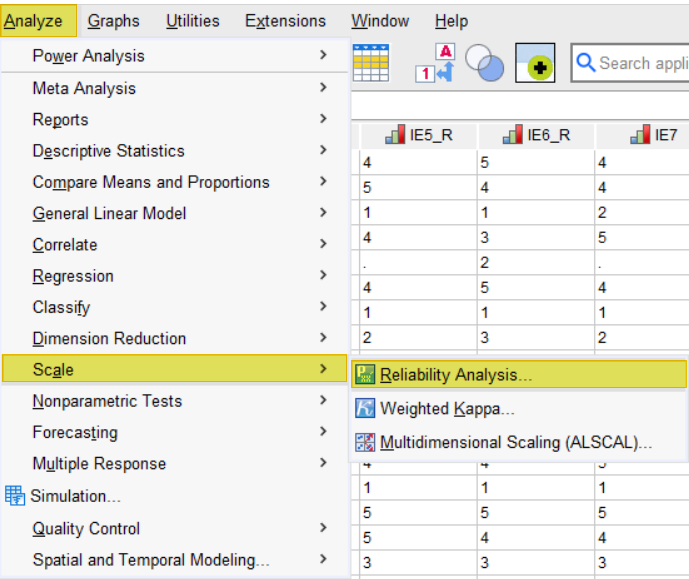
To calculate Cronbach’s alpha, click Analyze -> Scale -> Reliability Analysis as illustrated below.
This brings up the Reliability Analysis dialog box shown here. We recommend that you click the Reset button to clear any previous settings.
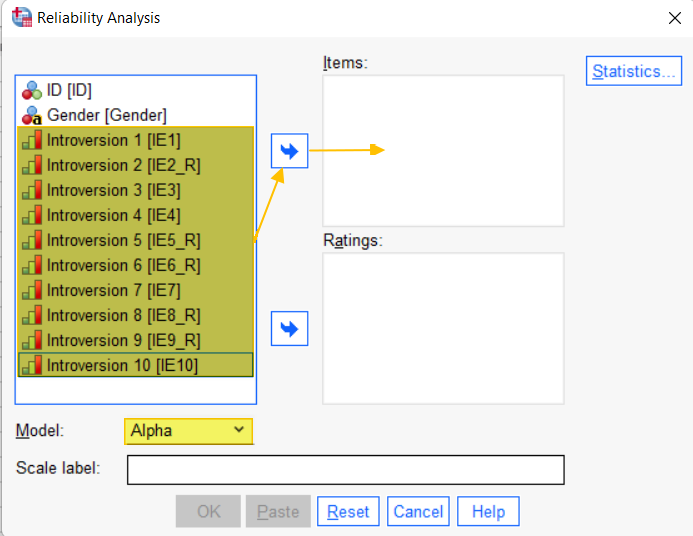
Holding down the CTRL key on your keyboard, select your scale items from the box on the left of the dialog box, and use the arrow button to move them to the Items box. Note that you should not move those variables that are not part of the scale. In our example, this means that we did not move the ID or Gender variables.
Ensure that the Model selected is Alpha. Your dialog box should now look something like the following.
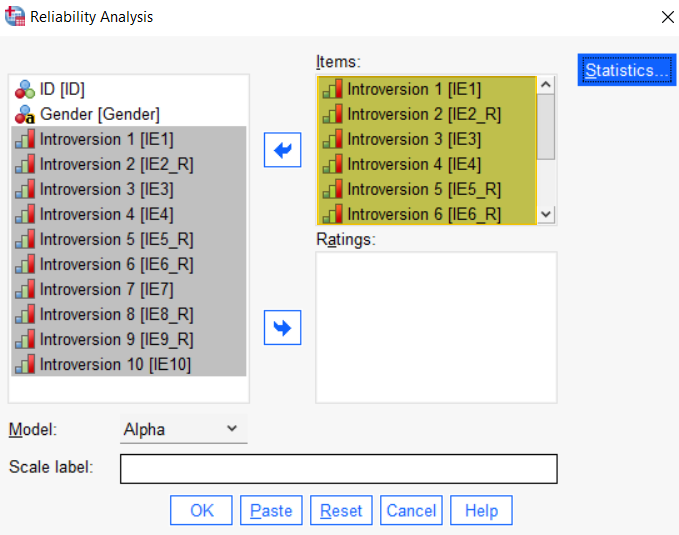
Click the Statistics button. This brings up the Reliability Analysis: Statistics dialog box illustrated below.
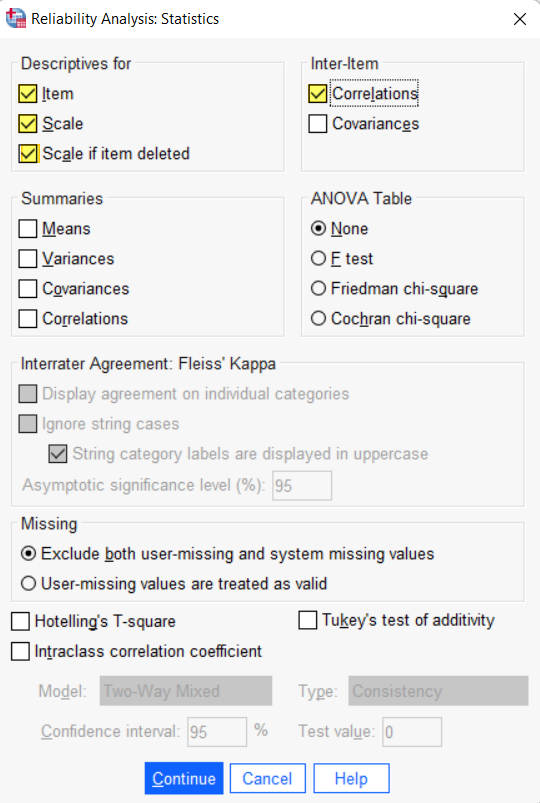
Under Descriptives for, select Item, Scale, and Scale if item deleted. Under Inter-item, select Correlations.
Click Continue to return to the Reliability Analysis dialog box.
Click OK.
The SPSS Output Viewer will pop up with the results of your Cronbach’s alpha calculation.
Results and Interpretation
Case Processing Summary
The first thing to review in the Output Viewer is the Case Processing Summary table. SPSS excludes all cases (rows) with missing values from its calculation of Cronbach’s alpha. In our example (illustrated below), we can see that SPSS has excluded two of our 20 cases because both of those cases have at least one missing value.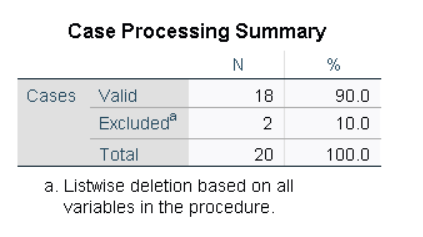
Cronbach’s Alpha
Next, we review the value for Cronbach’s Alpha in the Reliability Statistics table. SPSS has calculated a value of .980 for our example indicating a very high level of consistency between the items on the scale.
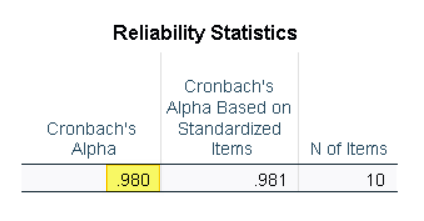
Cronbach’s alpha ranges from 0 to 1. Higher values indicate stronger relationships between the items on your scale. A Cronbach’s alpha of .7 or higher is usually considered to be acceptable.
Item-Total Statistics
The last result we will look at is the Item-Total Statistics table.
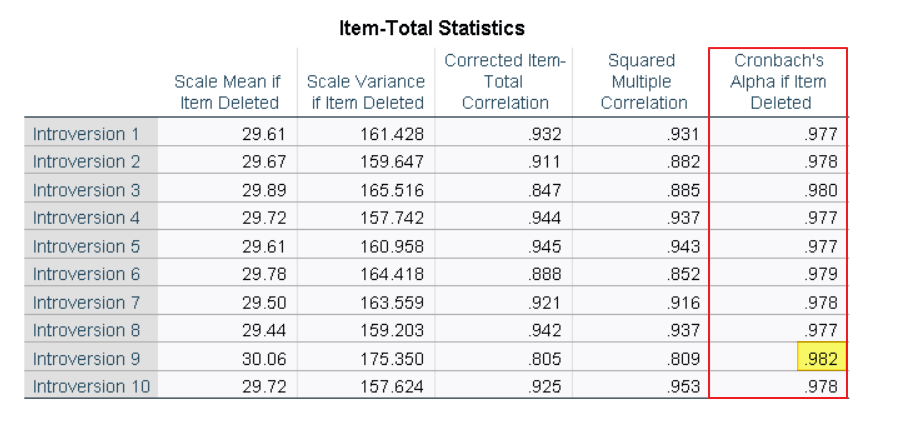
Sometimes, excluding an item from a set of scale items can increase the value of Cronbach’s alpha. If you wish to increase Cronbach’s alpha, review the Cronbach’s Alpha if Item Deleted column in the Item-Total Statistics table to see whether any of the values in this column are higher than the value of Cronbach’s Alpha in the Reliability Statistics table. In our example, the value for item 9 (.982) is slightly higher that the value of Cronbach’s alpha (.980) in the Reliability Statistics table.
If any of these values are noticeably higher than your Cronbach’s alpha value, you may wish to remove one or more items from your scale. We would not normally remove item 9 to increase the value of Cronbach’s alpha because that value is already very high and removing item 9 would only increase it slightly. In fact, the value of Cronbach’s alpha in our example data set is so high that it indicates redundancy within our set of Likert scale items. In this scenario, we might also opt to remove some of the scale items from our questionnaire but that is a topic for another tutorial.
Removing Scale Items to Increase Cronbach’s Alpha
If you decide to remove one or more of your scale items to increase your Cronbach’s alpha value, we suggest removing only one scale item at a time. We illustrate this process by removing item 9 from our example scale (although, as explained above, it would not normally make sense to remove this item to increase Cronbach’s alpha).
To remove an item, click Analyze -> Scale -> Reliability Analysis as you did when you performed the initial calculation.
In the Reliability Analysis dialog box, click on the item (variable) to be excluded from the Cronbach’s alpha calculation within the Items box, and use the arrow to move it out of that box as illustrated below.
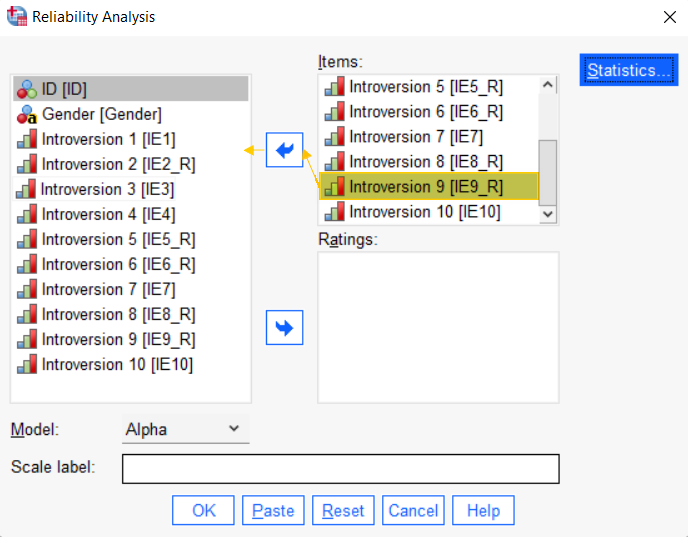
Click OK to re-calculate Cronbach’s alpha.
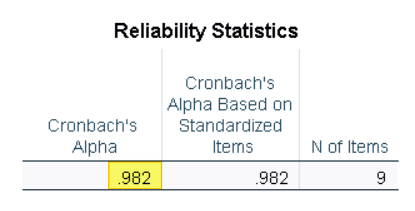
When we review the updated Reliability Statistics table, we see that the value of Cronbach’s alpha has increased to .982 (i.e., the value of Cronbach’s Alpha if Item Deleted in the Item-Total-Statistics table illustrated earlier). The updated Reliabilty Statistics table also tells us that the updated Cronbach’s alpha has been calculated on the basis of nine items (rather than 10 items in the initial calculation). If we wanted to remove additional scale items to increase the value of Cronbach’s alpha, we would repeat the steps above, removing one item at a time.
What Cronbach’s Alpha Can’t Tell You
It is important to note that Cronbach’s alpha is a measure of the reliability – or internal consistency – of your set of scale items only. A high Cronbach’s alpha doesn’t demonstrate that your scale is unidimensional. For example, you might calculate a high Cronbach’s alpha for a scale that includes some items about introversion (dimension 1) and other items about shyness (dimension 2).
If you also wish to determine whether your scale is unidimensional, you can perform exploratory factor analysis.
***************
That’s it for this tutorial. You should now be able to calculate and interpret Cronbach’s alpha in SPSS.
***************