Tables are used to organize numbers and/or text in columns and rows. Use tables (and charts) when doing so allows you to communicate your data more effectively than describing that data in the text.
In this tutorial we show you how to format your SPSS tables in APA style. We will do some of this formatting in SPSS itself, and some of it in Word.
Quick Steps
SPSS (complete these steps first)
- Create your desired table in SPSS
- Double-click on your table in the SPSS Output Viewer
- Click Format -> TableLooks
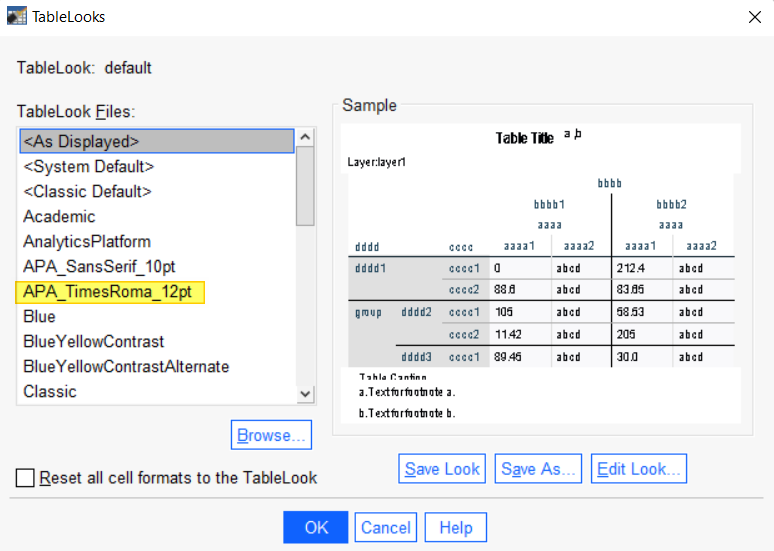
- Select APA_TimesRoma_12pt
- Click OK
- Deleted any unwanted columns or rows from your table
- Select the Cell Format table to format the values in your table as needed
- Select [X] to close the Pivot Table Editor.
- Right-click on your table and click Copy
Word (complete these steps after the SPSS steps)
- Open a Word document
- Right-click in your Word document
- Under Paste Options, select the Keep Source Formatting icon
- Insert a table number in bold left-aligned text before the table title and table
- Add a double-spaced line after the table number
- Modify the title of your table as applicable
- Ensure that your title is in italicized left-aligned text
- Add a double-spaced line after the table title
- Ensure that each of the column in your table has a heading in centered text
- Replace text headings with standard statistical symbols or abbreviations as applicable
- Modify the width of your table as desired (optional)
- Resize the columns within your table as desired (optional)
- Save your modified table in Word
Create Your Table in SPSS
We start from the assumption that you have already created your table in SPSS and that you now want to format it in APA style. We will illustrate this process using the Descriptives table below generated for a one-way ANOVA:

Apply the APA TableLook to Your Table
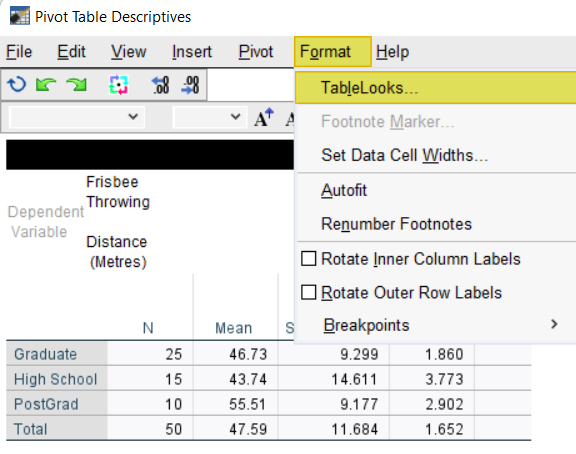
To format our table in SPSS, we first need to double-click on it in the SPSS Output Viewer. This opens the table in the Pivot Table Editor.
Next, we click Format -> TableLooks as illustrated below:
This brings up the TableLooks menu. Select APA_TimesRoma_12pt, and then click OK to return to the Pivot Table Editor
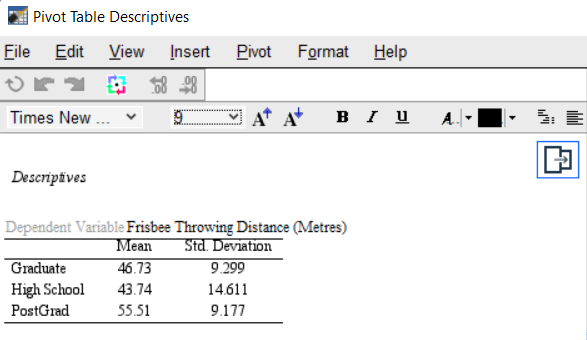
As illustrated below, our example table is now closer to APA style. For example, it has fewer gridlines. However, we need to make further edits as outlined below.

Note: If you can’t see all of your table in the Pivot Table Editor, you can select either of the two buttons highlighted above to see the whole table.
Delete Any Unwanted Columns or Rows from Your Table
If you want to delete any of the columns, or the Total row from your table, you can do this in the SPSS Pivot Table Editor as follows.
Holding down the left mouse button select the column, multiple adjacent columns, or row that you want to delete from your table (we selected the Std. Error, Lower Bound, Upper Bound, Minimum and Maximum columns as illustrated below). Then right click on the selected area and click Delete. After deleting these columns, we also delete the N column and the Total row from our table in the same way.

After deleting our unwanted columns and the Total row, our table now looks as follows:
Format Values in APA Style
Our next step is to format the values in our table in APA style as per the guidance contained in the APA Style Numbers and Statistics Guide (7th Edition).
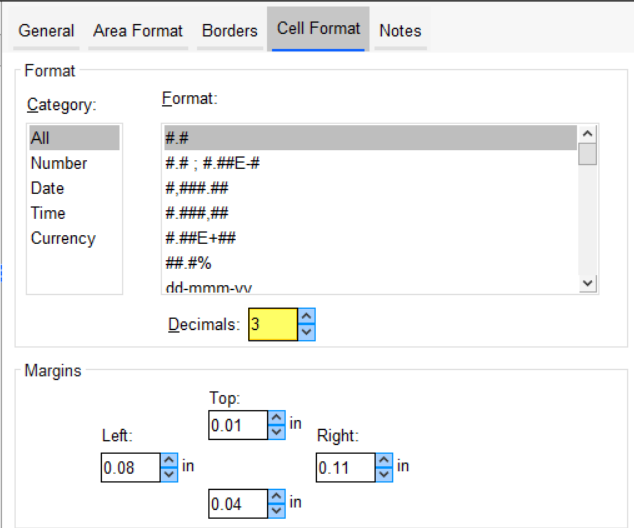
The mean values in our table are formatted correctly to two decimal places. However, the standard deviation values are formatted incorrectly to three decimal places, so we need to modify the formatting. Holding down the left mouse button select all of the values in the column that you want to format (but not the column heading). Select the Cell Format tab on the right of the Pivot Table Editor. If you don’t see the tabs illustrated below, click the (other) button highlighted in the screenshot below to make these appear.
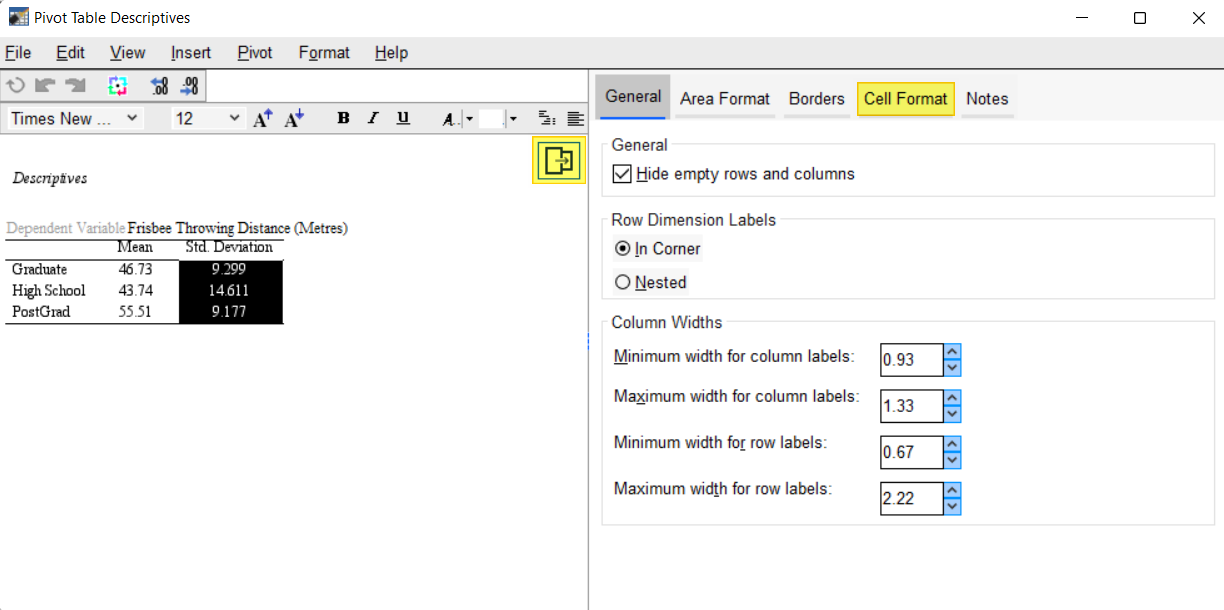
In the Cell Format table, use the up and down arrows to increase or decrease the decimals for the values in the selected column as needed. In our example, we decreased the decimals to 2.
Our example table now looks as follows:
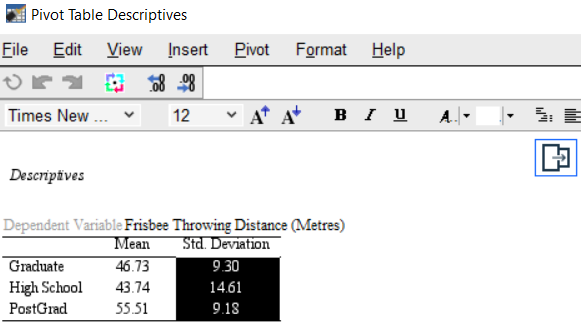
Once you have applied the APA Table Look, removed any unwanted rows or columns from your table, and formatted the values in your table in APA style, select the [X] at the top right corner of the Pivot Table Editor to close it. The changes you have made to your table will be saved in the SPSS Output Viewer.
Copy and Paste Your Table to Word
We are now ready to copy and past our table to Word for further editing. Right-click on your table in the SPSS Output Viewer and then select Copy.
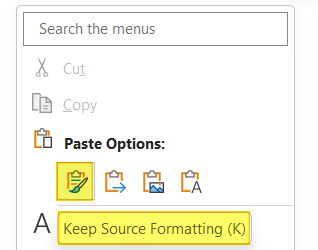
Open a Word document. Right-click in this document and, under Paste Options, select the icon for Keep Source Formatting as illustrated below (hover over the icons if you are not sure which one is Keep Source Formatting).
Editing Your Table in Word
Add a Table Number
All tables in an APA report need a table number. The table number should be typed in bold left-aligned text and it appears before the table title and table. Tables are numbered according to the order in which they appear. Our table of means and standard deviations will be the first table in our report so it will be Table 1. Add a double-spaced line between the table number and the table title.
Table Title
All tables in an APA report need a title. SPSS gave our example table the title “Descriptives”. A more informative title would be “Descriptive Statistics for [Dependent Variable].” Accordingly, we modify the title of our table so that it reads “Descriptive Statistics for Frisbee Throwing Distance (Meters).”
The title of your table should be italicized and left-aligned. Use Times New Roman font size 12, consistent with the content of the table. Add a double-spaced line after the table title.
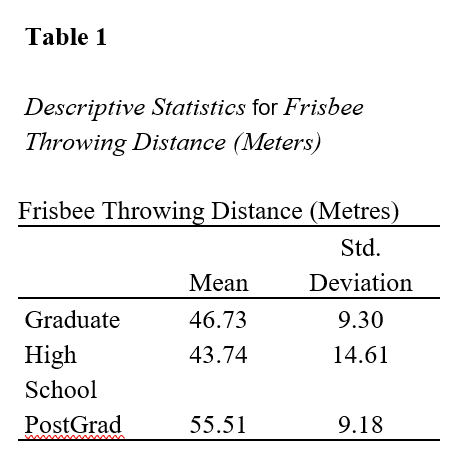
We delete the row containing the text “Frisbee Throwing Distance (Meters)” from our example table since this information is now included in the table title (we select the row, then right click and click Delete Rows )
Column Headings
Each column of an APA style table should have a heading and each heading should be centered. The first column of our table does not have a heading as created in SPSS so we need to add one. We add the text “Education Level” in centered text.
Replace text headings with the standard statistical symbols or abbreviations that represent them. In our example, we replace “Mean” with “M” and “Std. Deviation” with “SD.” Our table now looks as follows:
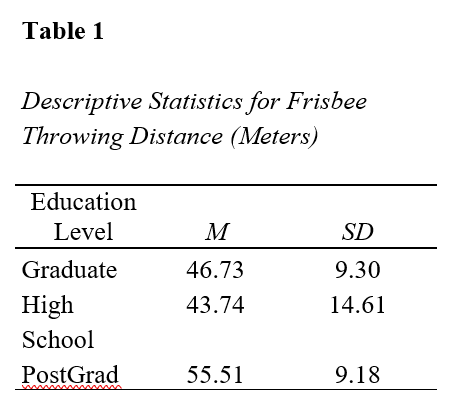
Table Body
The body of the table may be single-, one-and-a-half- or double-spaced. We opt to leave ours as single-spaced.
Table Notes
Table notes appear below the body of the table as described in the APA’s Table Setup guide. (Our table does not have any notes).
Modifying the Width of Your Table
If you wish to modify the width of your table, select the table using the box at the top left corner of the table, as highlighted below (hover over the table if you don’t see this box). Then drag the right side of the table (indicated with a red vertical line) to the right (to increase the width) or to the left (to decrease the width) as applicable.
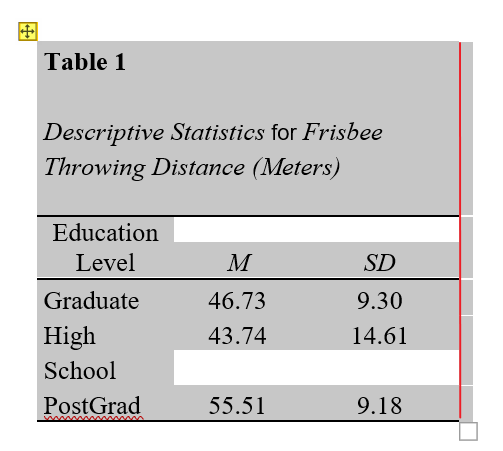
Once you have modified the width of your table we recommend, you may also wish to resize the columns within your table.
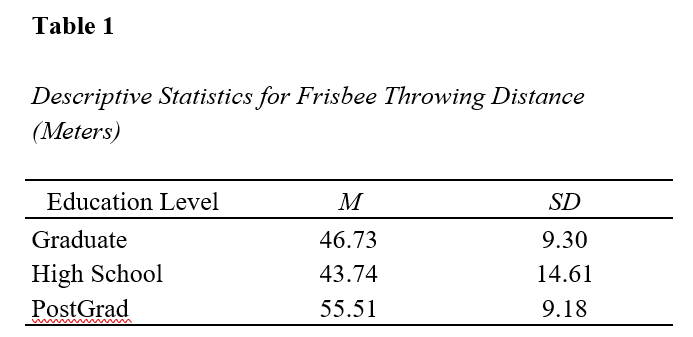
After you have taken the above steps, review your modified table and, if you are happy with it, save it in Word. Our APA style example table is illustrated below:
***************
That’s it for this tutorial. You should now be able to format SPSS tables in APA style.
***************