This tutorial shows you how to report a one way ANOVA (Analysis of Variance) from SPSS in APA style. First, we provide a template that you can use to report your one way ANOVA in APA style. Then we show you how to populate this template using the SPSS output from your own ANOVA. Finally, we show you an example of a one-way ANOVA report written using the template.
For more general information about formatting your reports in APA style, please refer to the APA Style website.
Template for Reporting a One-Way ANOVA in APA Style
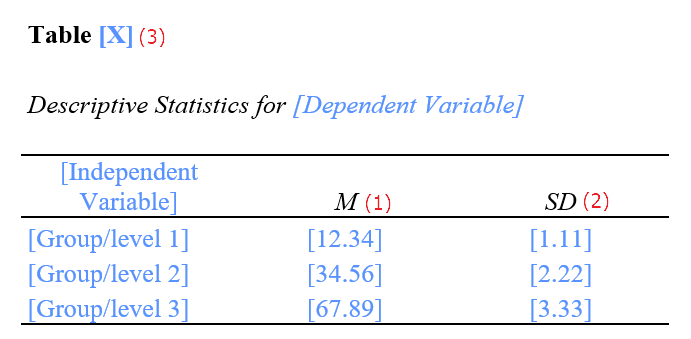
A template for reporting your one way ANOVA is below. Replace the [blue text in square brackets] with information from your own ANOVA. The (red numbers in parentheses) correspond to numbers on the screenshots of selected SPSS output below and/or our notes and tips for writing your report (also below).
APA Template Text
A one way ANOVA was performed to evaluate the relationship between [independent variable] and [dependent variable]. The means (1) and standard deviations (2) are presented in Table [table number] (3) below.
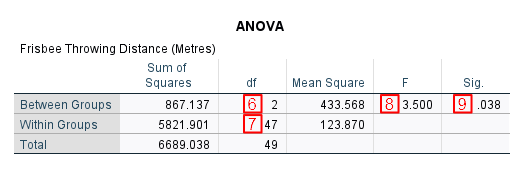
The ANOVA [was/was not] (4) significant at the [alpha level] (5) level, F([df between groups] (6), [df within groups] (7)) = [F value] (8) , p = [p value] (9).
Note: Include the following section only if the ANOVA was significant and you have conducted a post hoc Tukey HSD test:
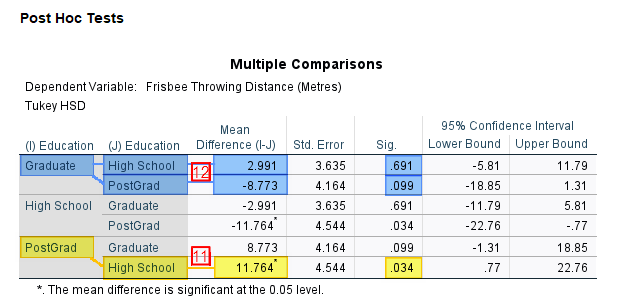
A post hoc Tukey HSD test (10) indicated that the mean [dependent variable] of the [group/level name] was significantly [higher/lower] than that of the [group/level name] (p = [p value]) (11). However, there were no significant differences between the mean [dependent variable] of the [group/level name] and [group/level name] (p = [p value]) (12).
Populating the APA Template With Your SPSS Output
The numbers in the screenshots of selected SPSS output below correspond to numbers in the APA reporting template above. Take these values from your own SPSS output and use them to populate our template.
Selected SPSS Output
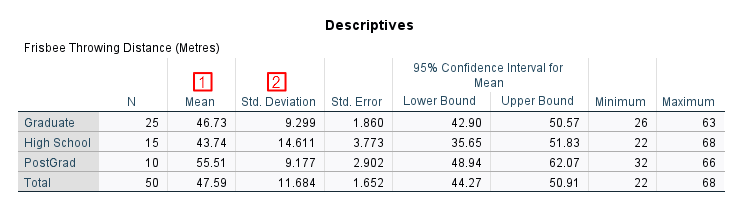
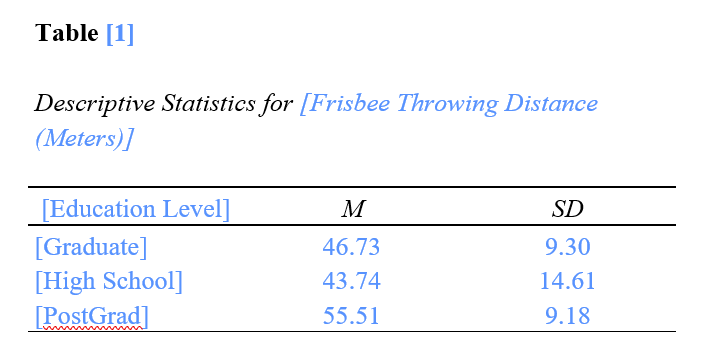
The screenshots of selected SPSS output below are from a one way ANOVA that we performed (using a fictitious data set) to find out whether level of education has an effect on the distance that a person can throw a frisbee.
Notes and Tips for Writing Your Report in APA Style
The APA Style Guide states: (a) that the first line of each paragraph should be indented 0.5 inches from the left margin; and (b) that the text should be double-spaced.
We encourage you to tweak the wording of the template as needed for your own ANOVA and to ensure that the report is clear and easy to read.
(1) Report the means to two decimal places.
(2) Report the standard deviations to two decimal places.
(3) Tables in APA reports should be numbered. If this is the first table in your report, it will be Table 1. The means and standard deviations could be included in the text, but they are often easier to read when they are presented in a table. See our tutorial on formatting SPSS tables in APA style.
(4) Your ANOVA is significant if the p value listed under “Sig.” in the ANOVA table in the SPSS output (see point (9)) is less than or equal to the alpha level you selected for your test in (5).
(5) The alpha level is selected before you conduct your one way ANOVA. An alpha level of .05 is typical.
(8) Report the F value from the SPSS output to two decimal places. You will also need to add a leading zero to your F value if it is less than 1.00 (for example an F value of .511 would be reported as 0.51).
(9) Report the exact p value to two or three decimal places as per the SPSS output. However, if the p value is .000, report it as < .001. Do not add a leading zero to your p value. (Note, for example, that we have used .038 rather than 0.038 to report the p value of our ANOVA in the example below).
Post-Hoc Testing
(10) If you select a different test for post hoc analysis, report that test instead of the Tukey HSD.
(11) First, list pair(s) of groups/levels of your independent variable that have significantly different means. Pairs of means that are significantly different at the .05 level are indicated with a * in the SPSS output. As above, report the exact p value(s) to two or three decimal places as per the SPSS output. However, if the p value is .000, report it as < .001. As noted in point (9) above, do not add leading zeros to your p values.
(12) Next, list pair(s) of groups/levels of your independent variable that do not have significantly different means. Again, report the exact p value(s) to two or three decimal places as per the SPSS output and do not add leading zeros to your p values.
Example of a One Way ANOVA Report in APA Style
A one-way ANOVA was performed to evaluate the relationship between a person’s [level of education (high school, graduate, postgraduate)] and [the distance that they can throw a frisbee (in meters)]. The means and standard deviations are presented in Table [1] below.
The ANOVA was significant at the .05 level, F(2, 47) = 3.50, p = .038
A post hoc Tukey HSD test indicated that the mean [frisbee throwing distance] of the [postgraduate group] was significantly [higher] than that of the [high school group] (p = [.034]). However, there were no significant differences between the mean [frisbee throwing distances] of the [high school] and [graduate groups] (p = [.691]) or between the [graduate] and [postgraduate groups] (p = [.099]).
***************
That’s it for this tutorial. You should now be able to report a one way ANOVA performed in SPSS in APA style.
***************