The independent samples t-test compares the means of a continuous dependent variable (e.g., exam scores) for two independent groups (e.g., males and females) to determine whether there is a significant difference between them.
In this tutorial, we will show you how to conduct and interpret an independent samples t-test in R, and how to report the results. We recommend working with RStudio, a program that makes it easier to work with R.
The Data
We start from the assumption that you have already imported or created a data frame in R. This should contain your continuous dependent variable (e.g., exam scores) and your independent grouping variable (e.g., gender). Please check out our tutorials on importing SPSS, Excel and CSV files into R, or our tutorial on manually entering data in R, if you need help with this step.
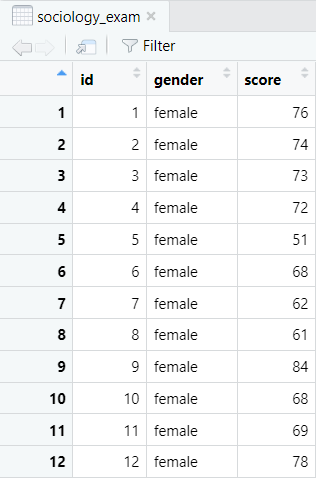
Our example data frame contains the gender and Sociology exam scores of 30 fictitious students. We want to determine whether there is a significant difference between the mean scores of the male and female students.
Independent Samples t-Test Assumptions
Before you conduct an independent samples t-test, you should check that your data meet the assumptions of the test. These are as a follows:
- Independence of observations: none of the observations in your data should be influenced by any of the other observations.
- Normal distribution: the dependent variable (e.g., exam scores) is more or less normally distributed for each group of the independent variable (e.g., males and females). You can test this assumption by computing the Shapiro-Wilk test by group as explained in our tutorial on assessing normality in R.
- Equality of variances: the variance of the dependent variable (e.g., exam scores) is approximately equal for the two groups (e.g., males and females). You can test this assumption in R with Levene’s test.
Note: if your data meet the first two assumptions, but not the equality of variances assumption, use the Welch t-test, a modification of the traditional independent samples t-test, as below.
The Independent Samples t-Test in R
To conduct the independent samples t-test in R, we can use the following command:
t.test(dv ~ iv, var.equal = TRUE, data = dataframe)
Replace the highlighted text in the above command as follows:
- dv: the dependent continuous variable (score in our example)
- iv: the independent grouping variable (gender in our example)
- dataframe: the name of the data frame that contains these two variables (sociology_exam in our example)
For our example, the command is as follows:
t.test(score ~ gender, var.equal = TRUE, data = sociology_exam)
We also recommend calculating the standard deviation of the continuous variable for each of your groups since you would usually report this when you write up your results:
aggregate(dataframe$dv, list(dataframe$iv), FUN = sd)
For our example, the command would be:
aggregate(sociology_exam$score, list(sociology_exam$gender), FUN = sd)
Running the independent t-test and the standard deviation calculations together for our example, we have:
t.test(score ~ gender, var.equal = TRUE, data = sociology_exam)
aggregate(sociology_exam$score, list(sociology_exam$gender), FUN = sd)
Once you select enter on your keyboard to execute the command, you will see the results of your independent samples t-test in the RStudio console, together with the standard deviations for your two groups.
The Results of the Independent Samples t-Test
Here is the output of the independent samples t-test for our example:
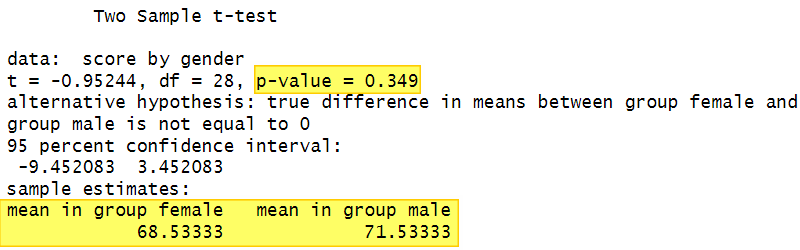
First, we review the means of the two groups. The mean Sociology exam score for the female students is a little lower than that for the male students.
Next, we look at the p value to assess whether the difference between the two groups is significant. The difference is significant if the p value is less than or equal to the alpha level we have selected for our test. Setting an alpha level of .05 or .01 is typical.
Our p value of 0.349 is higher than our selected alpha level of .05. On this basis, we can not conclude that there is a significant difference between the Sociology exam scores of male and female students.
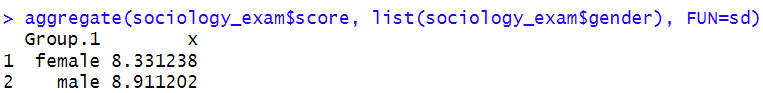
The standard deviations for our two groups also appear in RStudio as follows:
Reporting an Independent Samples t-Test
We can report the results of our independent samples t-test in APA Style as follows:
The results of an independent samples t-test indicated that there was no significant difference between the Sociology exam scores of male students (M = 71.53, SD = 8.91) and female students (M = 68.53, SD = 8.33), t(28) = -0.95, p = .349.
***************
That’s it for this tutorial. You should now be able to calculate and interpret an independent samples t-test in R, and write up the results of your test.
***************