In this tutorial, we show you how to manually enter data in R by working through a few simple examples. We will use RStudio, a program that makes it easier for users to work with R.
We start by showing you how to create vectors (or variables) in RStudio. Then we show you how to use these vectors to create data frames and matrices.
Note that if your data is already stored in another file type, such as Excel, CSV, or SPSS, you can simply import your data into RStudio instead.
Creating Vectors in R
In R, a vector is simply a variable that can include more than one value. In this section we are going to create a set of vectors containing values associated with six students in a fictitious study.
Rules and Conventions for Naming Vectors in R
Before we start creating vectors in RStudio, it is helpful to know the following rules and conventions.
Vector names in R can contain only the following:
- Letters (upper and lower case)
- Numbers
- _ (the underscore character)
- . (the period or full stop character)
Vector names should start with a letter. Consider separating vector names that contain more than one word with an underscore or a period. Alternatively, we can opt to start each new word in upper case. These naming conventions are illustrated below:
- final_score
- final.score
- FinalScore
It is good practice to give vectors short but meaningful names. Good practice also dictates that we be consistent with the format of our vector names. For example, we wouldn’t normally have one vector named mid.term.score and another named FinalScore.
Note that R is case sensitive, so it will treat FinalScore and finalscore as different vectors.
Data Types in R
There are six basic data types in R (numeric, character, integer, logical, complex, and raw). In this tutorial, we will focus on creating vectors containing the following three data types:
- Numeric data (e.g., 27, 5.73)
- Character data (e.g., "male", "female", "dog", "cat")
- Logical data (TRUE, FALSE)
Below, we show you the code that you need to create vectors of each of these data types. The blue text is the code that we type into the RStudio console. Our comments are presented in pink text starting with the character #. R will ignore anything on lines that start with this character. We select the enter key on our keyboard after typing the code to create the vector.
Creating a Numeric Vector in R
In the example below, we create a numeric vector containing the mid-term exam scores of the six students from our fictitious study. The name of our vector is mid.term, and the students’ scores are listed in sequence.
# create a numeric vector
mid.term <- c(76, 59, 73, 64, 71, 84)
Once we select the enter key on our keyboard, R creates our vector, and we see it in the Environment tab at the top right of our screen:
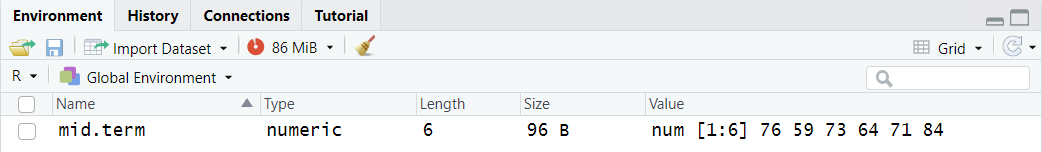
Here, we can see that our vector contains six values and that the data type is numeric.
We can view the list of vector values in RStudio by typing the following into the console – these values appear in black text below:
# display mid.term vector
mid.term
[1] 76 59 73 64 71 84
Creating a Character Vector in R
Next, we will create a character vector containing the gender of the six students in our fictitious study.
It is important to enter the values in the same sequence as we did for the mid.term vector. In our example, the first student in our study was a male who received a mid-term exam score of 76, the second student was a male who received a score of 59, and so on.
As we can see, the values in a character vector must be typed in quotation marks.
# create a character vector
gender <- c("male", "male", "female", "female", "male", "female")
Creating a Logical Vector in R
Next, we will create a logical vector. Logical vectors contain the values TRUE and FALSE. In our example, we are going to create a logical vector indicating whether each of our six students attended a study skills class. TRUE means that they attended the class and FALSE means that they didn’t attend it.
# create a logical vector
study.skills <- c(TRUE, FALSE, TRUE, TRUE, TRUE, FALSE)
Missing Values
Sometimes vectors include missing values. In R, we use NA to represent these missing values. In our example, we do not have a value for the fourth of our six students, so the fourth value in the vector will be NA as follows:
# create a vector with a missing value
final.exam <- c(79, 56, 70, NA, 76, 81)
Changing Vector Values
It is possible to change the values stored in our vectors. For example, if we want to change the second value of the final.exam vector (from 56) to 60, we can do this as follows:
# change a value in a vector
final.exam[2] <- 60
To check that our vector has been updated we can simply type the following in the RStudio console:
# view modified vector
final.exam
[1] 79 60 70 NA 76 81
The black text above shows us the values in the final.exam vector. We can see that the second value has indeed been changed to 60.
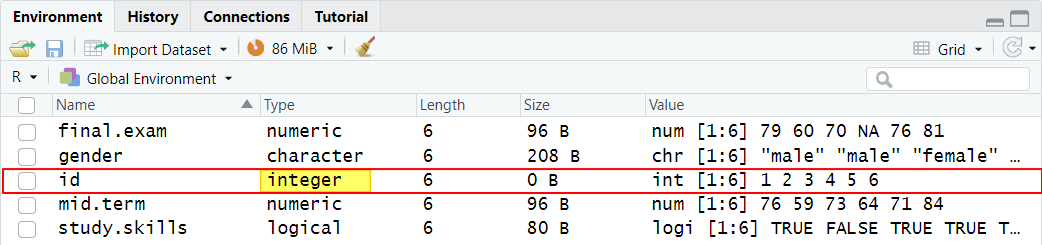
Creating a Unique ID Vector for a Data Frame in R
Since we are planning to create a data frame, it is a good idea to create an ID vector. We can do this as follows:
# create an id
id <- 1:6
Note that our id vector has been created as an integer. An integer is a specific type of numeric data that cannot have decimal places.
Creating a Data Frame in R
A data frame is a table of data in which each column represents a vector or variable, and each row represents a study participant, observation, or case.
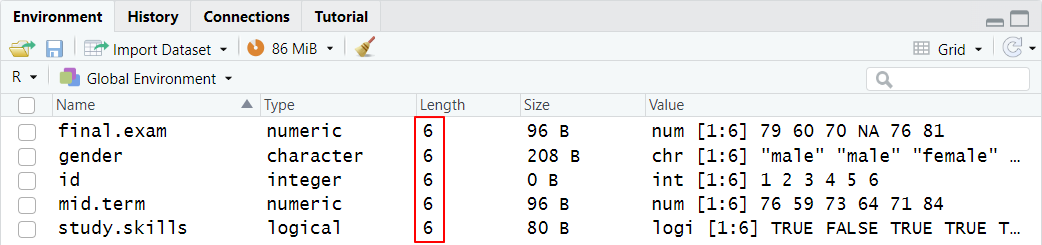
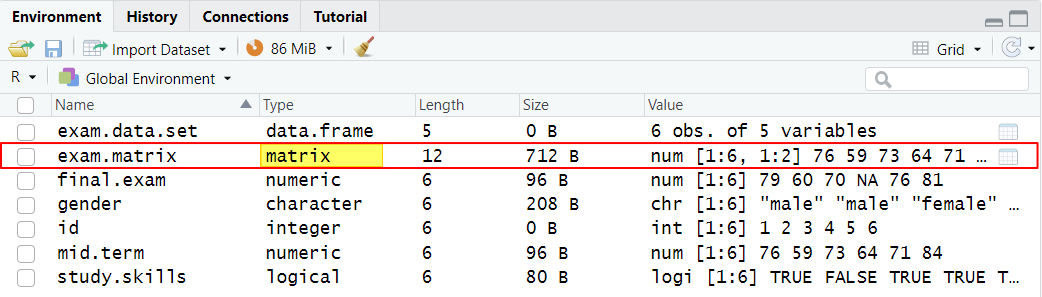
When we create a data frame in R, we can combine vectors of different types. For example, we can combine the vectors in the screenshot below even though these include numeric, character, logical and integer vectors. It is important, however, that each vector is of the same length. Note that all five of the vectors in the screenshot below contain exactly six values.
To create a data frame comprising these five vectors, we type the following in the RStudio console:
# create a data frame
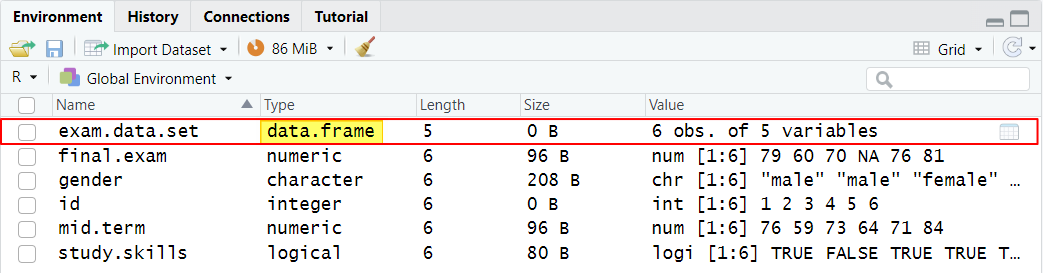
exam.data.set <- data.frame (id, gender, study.skills, mid.term, final.exam)
Once we select the enter key on our keyboard, the data frame that we have created appears in the Environment tab of RStudio as illustrated below:
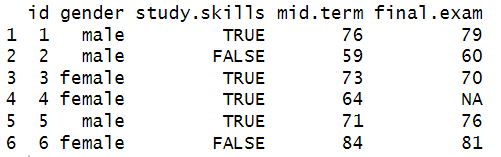
We can view the contents of our data frame as follows:
# view data frame
exam.data.set
Creating a Matrix from Vectors in R
A matrix is similar to a data frame. However, whereas we can combine different types of vectors (or variables) in a data frame (e.g., numeric, character, logical, etc.), we can only combine vectors of the same type in a matrix (e.g., numeric vectors only or character vectors only).
To create a matrix comprising the mid.term and final.exam vectors, both of which are numeric, we can type the following:
# create a matrix
exam.matrix <- cbind (mid.term, final.exam)
After we select the enter key on our keyboard, the matrix we have created will appear in the Environment tab of RStudio as per our screenshot below:
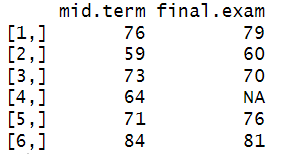
To view our matrix, we simply type the following:
# view matrix
exam.matrix
***************
That’s it for this tutorial. You should now be able to manually create vectors, data frames and matrices in RStudio.
***************