Levene’s test is used to determine whether the variance of a numeric variable (e.g., exam scores) is equal across two or more groups (e.g., male students and female students). That is, it is assesses equality of variances, an assumption of many statistical tests.
In this tutorial we will show you how to compute and interpret Levene’s test in R. We will be working with RStudio, a program that facilitates our interactions with the R programming language.
Install and Load the car package
We compute Levene’s test using the leveneTest() function in the car package. You can install this package using the following command:
install.packages("car")
We also need to load this package as follows:
library(car)
The Data
We start from the assumption that you have imported or entered your data frame in RStudio. (Check out our tutorials on importing data from SPSS, Excel and CSV into R, and manually entering data in R).
Your data frame should contain your continuous dependent variable (e.g., exam scores) and your independent grouping variable (e.g., gender) as per our screenshot below.
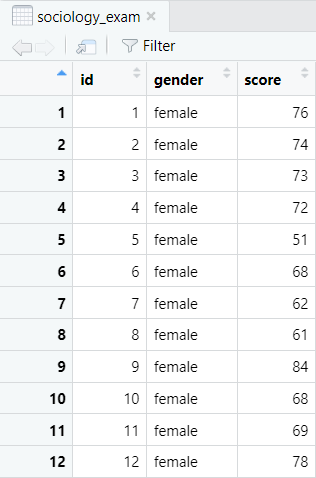
Our example data frame contains the Sociology exam scores and gender of 30 fictitious students. We will compute Levene’s test to determine whether the variance of these exam scores is the same for the female students as it is for the male students.
Computing Levene’s Test in R
We use the following command to compute Levene’s test in R:
leveneTest(numeric ~ group, data = dataframe)
Replace the highlighted text above as follows:
- numeric: the numeric variable (vector) for which you are computing Levene’s test (score in our example)
- group: the variable (vector) that you are using to group your numeric variable (in our example, this is gender)
- dataframe: the name of the data frame that contains your numeric variable and your grouping variable (sociology_exam in our example)
We enter the following command for our example:
leveneTest(score ~ gender, data = sociology_exam)
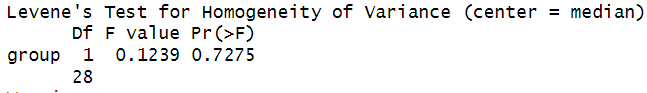
Once you select the enter key on your keyboard, you will see the results of your Levene’s test in RStudio.
You may also see a warning message stating: "In leveneTest.default(y = y, group = group, …) : group coerced to factor."
This is because the grouping variable that is used to compute Levene’s test must be coded as a factor in R. If it isn’t, R will convert it into a factor to perform the test. As long as the variable you used is a grouping variable, like gender in our example, then you don’t need to worry about this message.
Interpreting Levene’s Test
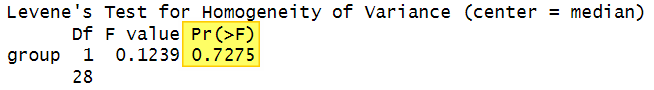
If the significance value for Levene’s test (highlighted above) is greater than .05, the equality of variances assumption is satisfied. In our example, the significance value of 0.7275 is greater than .05, so we conclude that the variance of Sociology exam scores is similar for male and female students.
If, however, the significance value computed for Levene’s test is less than or equal to .05, the equality of variances assumption is violated. This means that the variance of the numeric variable is not similar across groups. This has implications for the kinds of statistical tests that you should use to analyze your data.
Reporting the Results of Levene’s Test in APA Style
You can report the results of Levene’s test in APA style as follows:
Levene’s test indicated that there was equality of variances between the Sociology exam scores of male and female students, F(1, 28) = 0.12, p = .728.
***************
That’s it for this tutorial. You should now be able to compute and interpret Levene’s test in R, and report the results in APA style.
***************