In this tutorial, we’ll look at how to perform a one-way analysis of variance (ANOVA) for independent groups in SPSS, and how to interpret the result using Tukey’s HSD.
Quick Steps
- Click on Analyze -> Compare Means -> One-Way ANOVA
- Drag and drop your independent variable into the Factor box and dependent variable into the Dependent List box
- Click on Post Hoc, select Tukey, and press Continue
- Click on Options, select Homogeneity of variance test, and press Continue
- Press the OK button, and your result will pop up in the Output viewer
The Data
We’re starting from the assumption that you’ve already got your data into SPSS, and you’re looking at a Data View screen that looks a bit like this.

Our fictitious dataset contains a number of different variables. For the purposes of this tutorial, we’re interested in whether level of education has an effect on the ability of a person to throw a frisbee. Our independent variable, therefore, is Education, which has three levels – High School, Graduate and PostGrad – and our dependent variable is Frisbee Throwing Distance (i.e., the distance a subject throws a frisbee).
The one-way ANOVA test allows us to determine whether there is a significant difference in the mean distances thrown by each of the groups.
One-Way Analysis of Variance (ANOVA)
To start, click on Analyze -> Compare Means -> One-Way ANOVA.

This will bring up the One-Way ANOVA dialog box.
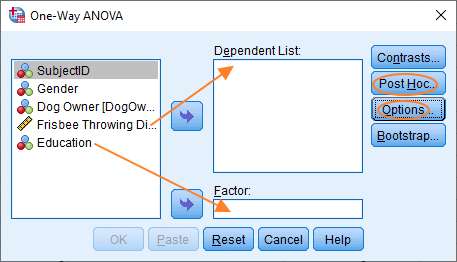
To set up the test, you’ve got to get your independent variable into the Factor box (Education in this case, see above) and dependent variable into the Dependent List box. You can do this by dragging and dropping, or by highlighting a variable, and then clicking on the appropriate arrow in the middle of the dialog.
After you’ve moved the variables over, you should click the Post Hoc button, which will allow you to specify the post hoc test(s) you wish to run.
The ANOVA test will tell you whether there is a significant difference between the means of two or more levels of a variable. However, if you’ve got more than two levels it’s not going to tell you between which of the various pairs of means the difference is significant. You need to do a post hoc test to find this out.
Post Hoc Tests
The Post Hoc dialog box looks like this.
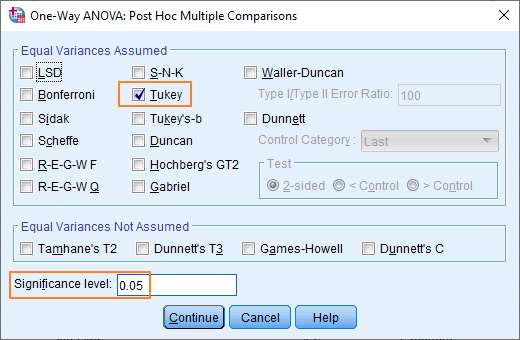
You should select Tukey, as shown above, and ensure that your significance level is set to 0.05 (or whatever alpha level is right for your study).
Now press Continue to return to the previous dialog box.
Options
You should be looking at this dialog box again.
Click Options to bring up the Options dialog box.
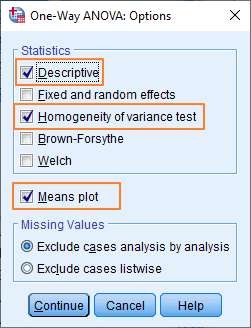
At the very least, you should select the Homogeneity of variance test option (since homogeneity of variance is required for the ANOVA test). Descriptive statistics and a Means plot are also useful.
Once you’ve made your selections, click Continue.
At this point, you’re ready to run the test.
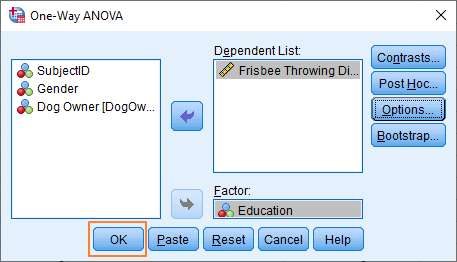
Review your options, and click the OK button. You’ll see the result pop up in the Output Viewer.
The Result
SPSS produces a lot of data for the one-way ANOVA test. Let’s deal with the important bits in turn.
Descriptives
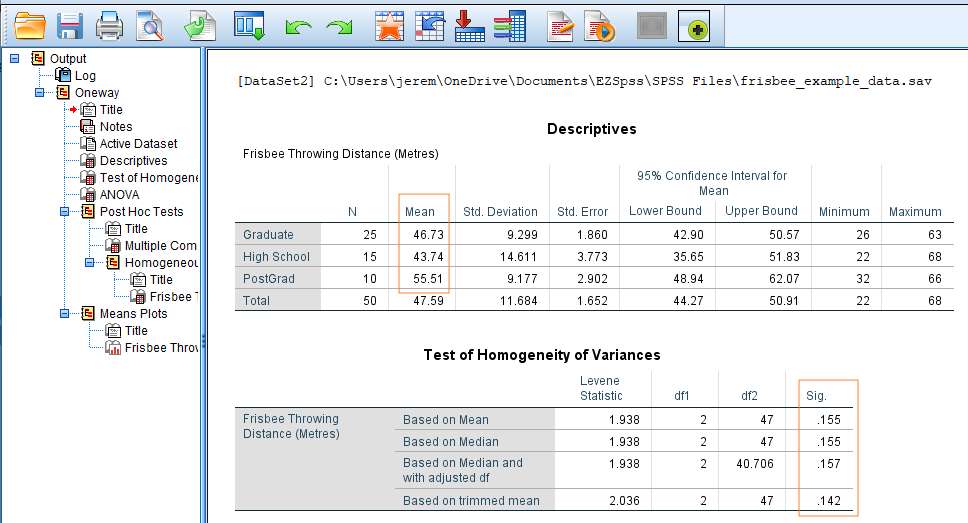
It’s worth having a quick glance at the descriptive statistics generated by SPSS.
If you look above, you’ll see that our sample data produces a difference in the mean scores of the three levels of our education variable. In particular, the data analysis shows that the subjects in the PostGrad group throw the frisbee quite a bit further than subjects in the other two groups. The key question, of course, is whether the difference in mean scores reaches significance.
Homogeneity of Variances
A requirement for the ANOVA test is that the variances of each comparison group are equal. We have tested this using the Levene statistic. What you’re looking for here is a significance value that is greater than .05. You don’t want a significant result, since a significant result would suggest a real difference between variances.
In our example, as you can see above, the significance value of the Levene statistic based on a comparison of medians is .155. This is not a significant result, which means the requirement of homogeneity of variance has been met, and the ANOVA test can be considered to be robust.
F Statistic (ANOVA Result)
Now that we know we have equal variances, we can look at the result of the ANOVA test.
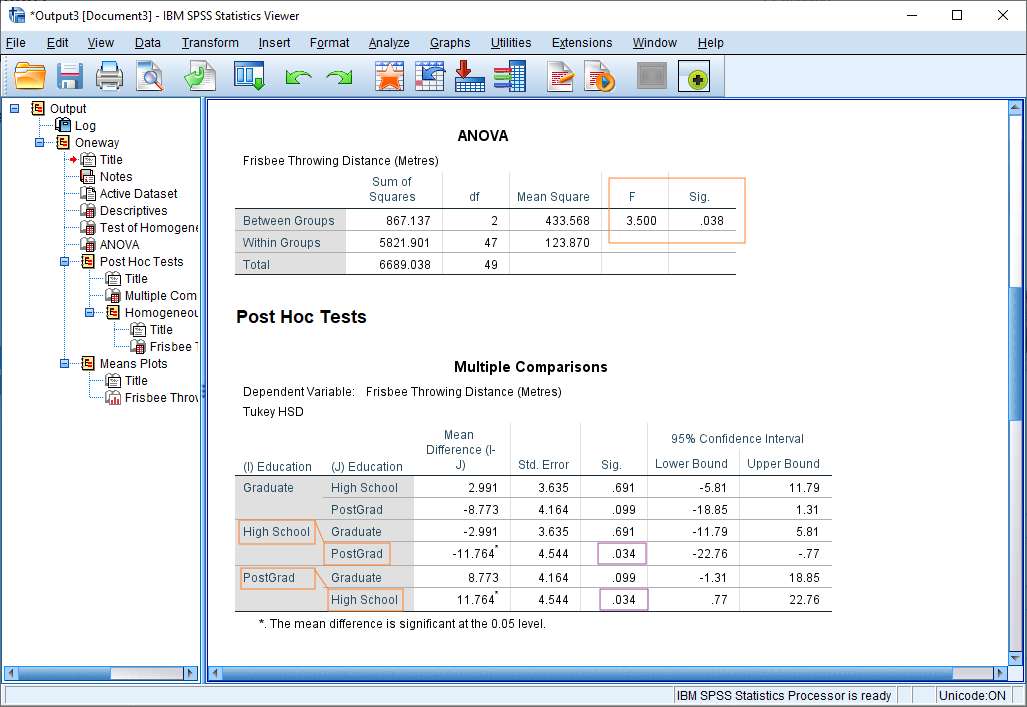
The ANOVA result is easy to read. You’re looking for the value of F that appears in the Between Groups row (see above) and whether this reaches significance (next column along).
In our example, we have a significant result. The value of F is 3.50, which reaches significance with a p-value of .038 (which is less than the .05 alpha level). This means there is a statistically significant difference between the means of the different levels of the education variable.
However, as yet we don’t know between which of the various pairs of means the difference is significant. For this we need to look at the result of the post hoc Tukey HSD test.
Tukey HSD
If you take a look at the Multiple Comparisons table above you’ll see that significance values have been generated for the mean differences between pairs of the various levels of the education variable (Graduate – High School; Graduate – PostGrad; and High School – PostGrad).
In our example, the Tukey HSD (Honest Significant Difference) shows that it is only the mean difference between the High School and PostGrad groups that reaches significance (see the Sig. column, above). The p-value is .034, which is less than the standard .05 alpha level.
Report the Result
When reporting the result it’s normal to reference both the ANOVA test and the post hoc Tukey HSD test.
Thus, given our example here, you could write something like:
There was a statistically significant difference between groups as demonstrated by one-way ANOVA (F(2,47) = 3.50, p = .038). A Tukey post hoc test showed that the PostGrad group was able to throw the frisbee statistically significantly further than the High School group (p = .034). There was no statistically significant difference between the Graduate and High School groups (p = . 691) or between the Graduate and PostGrad groups (p = .099).
Alternatively, please see our tutorial on reporting the results of a one-way ANOVA from SPSS in APA style.
***************
Right, that’s it for this tutorial. You should now be able to perform a one-way ANOVA test in SPSS, check the homogeneity of variance assumption has been met, run a post hoc test, and interpret and report your result. Check out our tutorial if you’d like to export the SPSS output for your ANOVA to another application such as Word, Excel, or PDF.